Syrian vs Immigrants from Fiji Female Disability
COMPARE
Syrian
Immigrants from Fiji
Female Disability
Female Disability Comparison
Syrians
Immigrants from Fiji
12.1%
FEMALE DISABILITY
76.9/ 100
METRIC RATING
154th/ 347
METRIC RANK
12.3%
FEMALE DISABILITY
38.2/ 100
METRIC RATING
179th/ 347
METRIC RANK
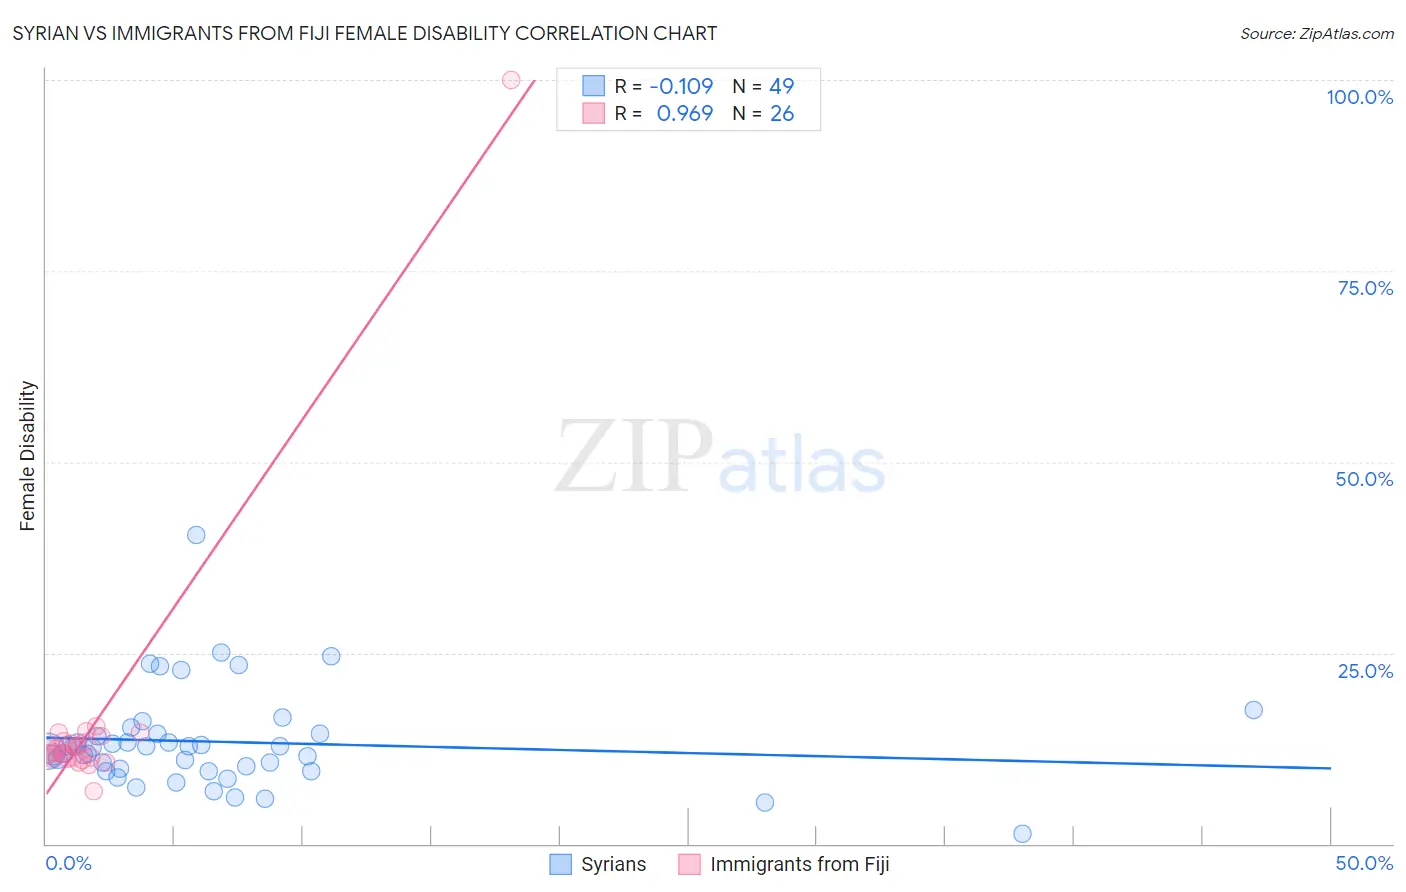
Syrian vs Immigrants from Fiji Female Disability Correlation Chart
The statistical analysis conducted on geographies consisting of 266,312,876 people shows a poor negative correlation between the proportion of Syrians and percentage of females with a disability in the United States with a correlation coefficient (R) of -0.109 and weighted average of 12.1%. Similarly, the statistical analysis conducted on geographies consisting of 93,754,243 people shows a perfect positive correlation between the proportion of Immigrants from Fiji and percentage of females with a disability in the United States with a correlation coefficient (R) of 0.969 and weighted average of 12.3%, a difference of 1.6%.
Female Disability Correlation Summary
| Measurement | Syrian | Immigrants from Fiji |
| Minimum | 1.3% | 6.9% |
| Maximum | 40.4% | 100.0% |
| Range | 39.1% | 93.1% |
| Mean | 13.3% | 15.6% |
| Median | 12.7% | 12.0% |
| Interquartile 25% (IQ1) | 9.7% | 11.2% |
| Interquartile 75% (IQ3) | 14.4% | 13.4% |
| Interquartile Range (IQR) | 4.7% | 2.2% |
| Standard Deviation (Sample) | 6.5% | 17.3% |
| Standard Deviation (Population) | 6.4% | 17.0% |
Similar Demographics by Female Disability
Demographics Similar to Syrians by Female Disability
In terms of female disability, the demographic groups most similar to Syrians are Ghanaian (12.1%, a difference of 0.020%), Immigrants from Scotland (12.0%, a difference of 0.13%), Sudanese (12.0%, a difference of 0.13%), Moroccan (12.1%, a difference of 0.20%), and Icelander (12.0%, a difference of 0.22%).
| Demographics | Rating | Rank | Female Disability |
| Nigerians | 84.0 /100 | #147 | Excellent 12.0% |
| Immigrants | Kenya | 83.1 /100 | #148 | Excellent 12.0% |
| Greeks | 82.0 /100 | #149 | Excellent 12.0% |
| Immigrants | Moldova | 81.4 /100 | #150 | Excellent 12.0% |
| Icelanders | 80.7 /100 | #151 | Excellent 12.0% |
| Immigrants | Scotland | 79.3 /100 | #152 | Good 12.0% |
| Sudanese | 79.1 /100 | #153 | Good 12.0% |
| Syrians | 76.9 /100 | #154 | Good 12.1% |
| Ghanaians | 76.6 /100 | #155 | Good 12.1% |
| Moroccans | 72.9 /100 | #156 | Good 12.1% |
| Danes | 72.5 /100 | #157 | Good 12.1% |
| Immigrants | Middle Africa | 72.4 /100 | #158 | Good 12.1% |
| Immigrants | Central America | 67.7 /100 | #159 | Good 12.1% |
| Immigrants | Guatemala | 66.0 /100 | #160 | Good 12.1% |
| Guyanese | 64.7 /100 | #161 | Good 12.1% |
Demographics Similar to Immigrants from Fiji by Female Disability
In terms of female disability, the demographic groups most similar to Immigrants from Fiji are Albanian (12.3%, a difference of 0.010%), Immigrants from Canada (12.3%, a difference of 0.040%), Norwegian (12.3%, a difference of 0.050%), Cuban (12.3%, a difference of 0.070%), and Iraqi (12.3%, a difference of 0.090%).
| Demographics | Rating | Rank | Female Disability |
| Haitians | 51.9 /100 | #172 | Average 12.2% |
| Immigrants | Mexico | 50.8 /100 | #173 | Average 12.2% |
| Immigrants | England | 50.0 /100 | #174 | Average 12.2% |
| Immigrants | St. Vincent and the Grenadines | 49.7 /100 | #175 | Average 12.2% |
| Immigrants | Guyana | 43.1 /100 | #176 | Average 12.2% |
| Immigrants | Ghana | 42.5 /100 | #177 | Average 12.2% |
| Immigrants | Western Europe | 40.9 /100 | #178 | Average 12.2% |
| Immigrants | Fiji | 38.2 /100 | #179 | Fair 12.3% |
| Albanians | 37.9 /100 | #180 | Fair 12.3% |
| Immigrants | Canada | 37.2 /100 | #181 | Fair 12.3% |
| Norwegians | 36.9 /100 | #182 | Fair 12.3% |
| Cubans | 36.5 /100 | #183 | Fair 12.3% |
| Iraqis | 36.0 /100 | #184 | Fair 12.3% |
| Immigrants | Uzbekistan | 33.9 /100 | #185 | Fair 12.3% |
| Austrians | 33.3 /100 | #186 | Fair 12.3% |