Syrian vs Immigrants from Poland Female Disability
COMPARE
Syrian
Immigrants from Poland
Female Disability
Female Disability Comparison
Syrians
Immigrants from Poland
12.1%
FEMALE DISABILITY
76.9/ 100
METRIC RATING
154th/ 347
METRIC RANK
11.6%
FEMALE DISABILITY
99.6/ 100
METRIC RATING
84th/ 347
METRIC RANK
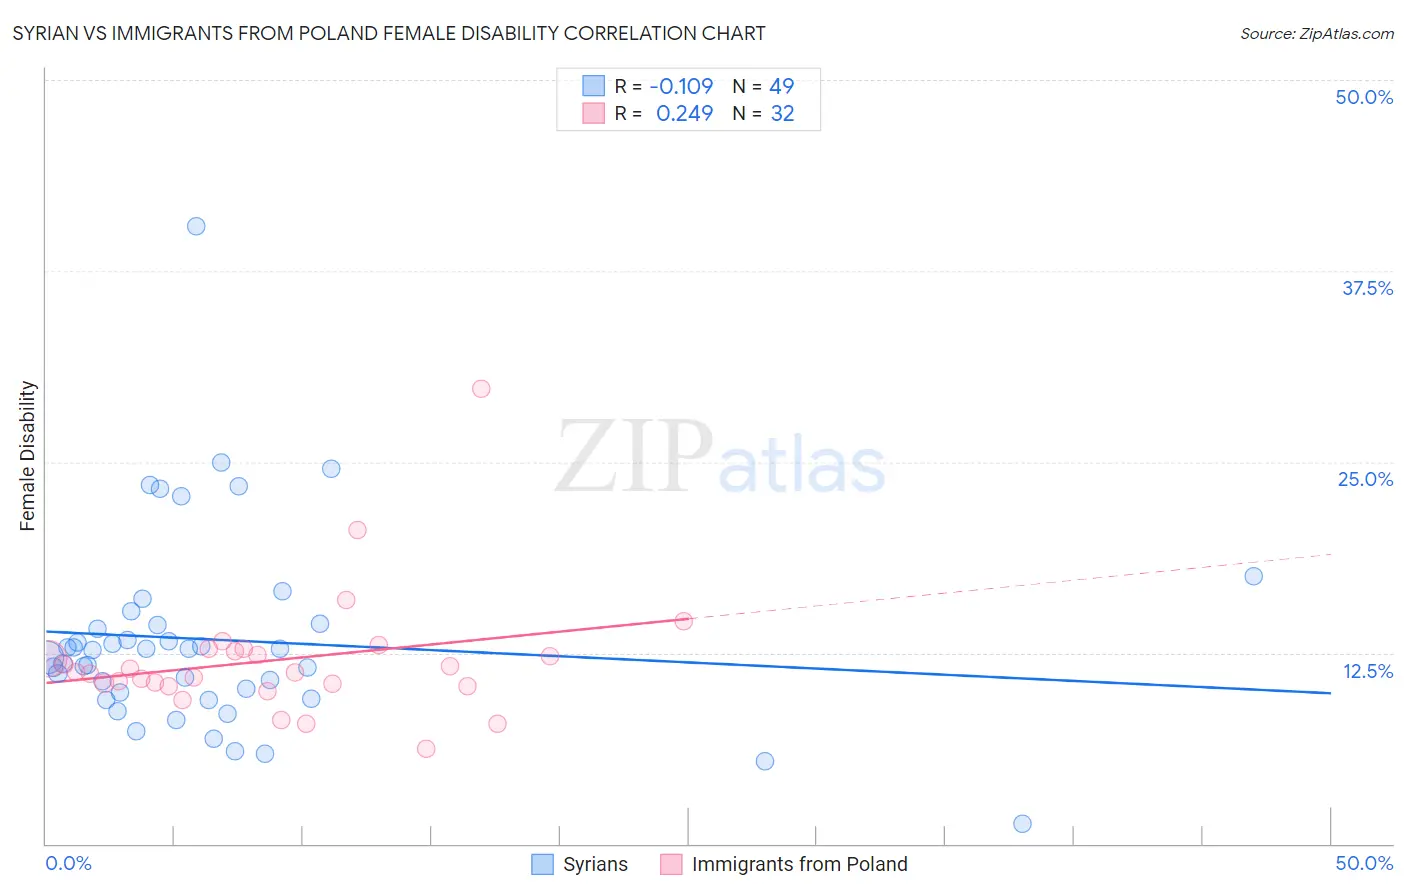
Syrian vs Immigrants from Poland Female Disability Correlation Chart
The statistical analysis conducted on geographies consisting of 266,312,876 people shows a poor negative correlation between the proportion of Syrians and percentage of females with a disability in the United States with a correlation coefficient (R) of -0.109 and weighted average of 12.1%. Similarly, the statistical analysis conducted on geographies consisting of 304,835,870 people shows a weak positive correlation between the proportion of Immigrants from Poland and percentage of females with a disability in the United States with a correlation coefficient (R) of 0.249 and weighted average of 11.6%, a difference of 4.2%.
Female Disability Correlation Summary
| Measurement | Syrian | Immigrants from Poland |
| Minimum | 1.3% | 6.2% |
| Maximum | 40.4% | 29.8% |
| Range | 39.1% | 23.6% |
| Mean | 13.3% | 12.0% |
| Median | 12.7% | 11.2% |
| Interquartile 25% (IQ1) | 9.7% | 10.4% |
| Interquartile 75% (IQ3) | 14.4% | 12.7% |
| Interquartile Range (IQR) | 4.7% | 2.3% |
| Standard Deviation (Sample) | 6.5% | 4.1% |
| Standard Deviation (Population) | 6.4% | 4.1% |
Similar Demographics by Female Disability
Demographics Similar to Syrians by Female Disability
In terms of female disability, the demographic groups most similar to Syrians are Ghanaian (12.1%, a difference of 0.020%), Immigrants from Scotland (12.0%, a difference of 0.13%), Sudanese (12.0%, a difference of 0.13%), Moroccan (12.1%, a difference of 0.20%), and Icelander (12.0%, a difference of 0.22%).
| Demographics | Rating | Rank | Female Disability |
| Nigerians | 84.0 /100 | #147 | Excellent 12.0% |
| Immigrants | Kenya | 83.1 /100 | #148 | Excellent 12.0% |
| Greeks | 82.0 /100 | #149 | Excellent 12.0% |
| Immigrants | Moldova | 81.4 /100 | #150 | Excellent 12.0% |
| Icelanders | 80.7 /100 | #151 | Excellent 12.0% |
| Immigrants | Scotland | 79.3 /100 | #152 | Good 12.0% |
| Sudanese | 79.1 /100 | #153 | Good 12.0% |
| Syrians | 76.9 /100 | #154 | Good 12.1% |
| Ghanaians | 76.6 /100 | #155 | Good 12.1% |
| Moroccans | 72.9 /100 | #156 | Good 12.1% |
| Danes | 72.5 /100 | #157 | Good 12.1% |
| Immigrants | Middle Africa | 72.4 /100 | #158 | Good 12.1% |
| Immigrants | Central America | 67.7 /100 | #159 | Good 12.1% |
| Immigrants | Guatemala | 66.0 /100 | #160 | Good 12.1% |
| Guyanese | 64.7 /100 | #161 | Good 12.1% |
Demographics Similar to Immigrants from Poland by Female Disability
In terms of female disability, the demographic groups most similar to Immigrants from Poland are Immigrants from Serbia (11.6%, a difference of 0.030%), Palestinian (11.6%, a difference of 0.030%), Immigrants from Cameroon (11.6%, a difference of 0.040%), Luxembourger (11.6%, a difference of 0.050%), and Immigrants from Denmark (11.6%, a difference of 0.10%).
| Demographics | Rating | Rank | Female Disability |
| Immigrants | Afghanistan | 99.7 /100 | #77 | Exceptional 11.5% |
| Immigrants | South Africa | 99.7 /100 | #78 | Exceptional 11.5% |
| Sierra Leoneans | 99.7 /100 | #79 | Exceptional 11.5% |
| Immigrants | Jordan | 99.7 /100 | #80 | Exceptional 11.5% |
| Eastern Europeans | 99.7 /100 | #81 | Exceptional 11.5% |
| Luxembourgers | 99.6 /100 | #82 | Exceptional 11.6% |
| Immigrants | Serbia | 99.6 /100 | #83 | Exceptional 11.6% |
| Immigrants | Poland | 99.6 /100 | #84 | Exceptional 11.6% |
| Palestinians | 99.6 /100 | #85 | Exceptional 11.6% |
| Immigrants | Cameroon | 99.6 /100 | #86 | Exceptional 11.6% |
| Immigrants | Denmark | 99.5 /100 | #87 | Exceptional 11.6% |
| Yup'ik | 99.5 /100 | #88 | Exceptional 11.6% |
| Vietnamese | 99.5 /100 | #89 | Exceptional 11.6% |
| Immigrants | Romania | 99.5 /100 | #90 | Exceptional 11.6% |
| Immigrants | Zimbabwe | 99.5 /100 | #91 | Exceptional 11.6% |