Syrian vs Immigrants from Iran Female Disability
COMPARE
Syrian
Immigrants from Iran
Female Disability
Female Disability Comparison
Syrians
Immigrants from Iran
12.1%
FEMALE DISABILITY
76.9/ 100
METRIC RATING
154th/ 347
METRIC RANK
10.8%
FEMALE DISABILITY
100.0/ 100
METRIC RATING
18th/ 347
METRIC RANK
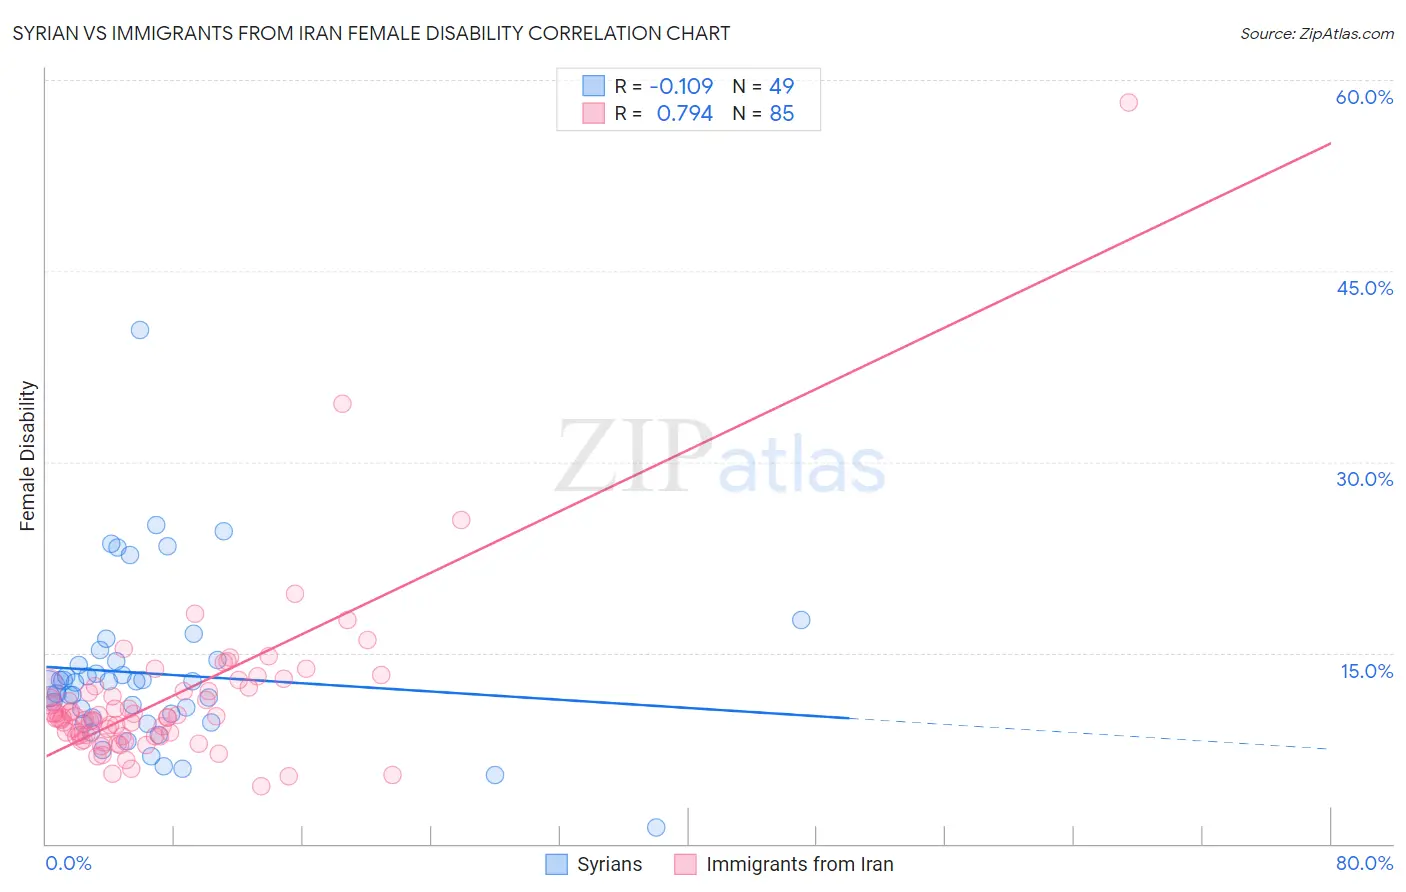
Syrian vs Immigrants from Iran Female Disability Correlation Chart
The statistical analysis conducted on geographies consisting of 266,312,876 people shows a poor negative correlation between the proportion of Syrians and percentage of females with a disability in the United States with a correlation coefficient (R) of -0.109 and weighted average of 12.1%. Similarly, the statistical analysis conducted on geographies consisting of 279,884,220 people shows a strong positive correlation between the proportion of Immigrants from Iran and percentage of females with a disability in the United States with a correlation coefficient (R) of 0.794 and weighted average of 10.8%, a difference of 11.3%.
Female Disability Correlation Summary
| Measurement | Syrian | Immigrants from Iran |
| Minimum | 1.3% | 4.5% |
| Maximum | 40.4% | 58.2% |
| Range | 39.1% | 53.8% |
| Mean | 13.3% | 11.3% |
| Median | 12.7% | 9.9% |
| Interquartile 25% (IQ1) | 9.7% | 8.5% |
| Interquartile 75% (IQ3) | 14.4% | 12.1% |
| Interquartile Range (IQR) | 4.7% | 3.6% |
| Standard Deviation (Sample) | 6.5% | 6.6% |
| Standard Deviation (Population) | 6.4% | 6.6% |
Similar Demographics by Female Disability
Demographics Similar to Syrians by Female Disability
In terms of female disability, the demographic groups most similar to Syrians are Ghanaian (12.1%, a difference of 0.020%), Immigrants from Scotland (12.0%, a difference of 0.13%), Sudanese (12.0%, a difference of 0.13%), Moroccan (12.1%, a difference of 0.20%), and Icelander (12.0%, a difference of 0.22%).
| Demographics | Rating | Rank | Female Disability |
| Nigerians | 84.0 /100 | #147 | Excellent 12.0% |
| Immigrants | Kenya | 83.1 /100 | #148 | Excellent 12.0% |
| Greeks | 82.0 /100 | #149 | Excellent 12.0% |
| Immigrants | Moldova | 81.4 /100 | #150 | Excellent 12.0% |
| Icelanders | 80.7 /100 | #151 | Excellent 12.0% |
| Immigrants | Scotland | 79.3 /100 | #152 | Good 12.0% |
| Sudanese | 79.1 /100 | #153 | Good 12.0% |
| Syrians | 76.9 /100 | #154 | Good 12.1% |
| Ghanaians | 76.6 /100 | #155 | Good 12.1% |
| Moroccans | 72.9 /100 | #156 | Good 12.1% |
| Danes | 72.5 /100 | #157 | Good 12.1% |
| Immigrants | Middle Africa | 72.4 /100 | #158 | Good 12.1% |
| Immigrants | Central America | 67.7 /100 | #159 | Good 12.1% |
| Immigrants | Guatemala | 66.0 /100 | #160 | Good 12.1% |
| Guyanese | 64.7 /100 | #161 | Good 12.1% |
Demographics Similar to Immigrants from Iran by Female Disability
In terms of female disability, the demographic groups most similar to Immigrants from Iran are Immigrants from Venezuela (10.9%, a difference of 0.21%), Indian (Asian) (10.8%, a difference of 0.38%), Immigrants from Pakistan (10.9%, a difference of 0.39%), Okinawan (10.8%, a difference of 0.70%), and Asian (10.9%, a difference of 0.75%).
| Demographics | Rating | Rank | Female Disability |
| Immigrants | Korea | 100.0 /100 | #11 | Exceptional 10.6% |
| Immigrants | Israel | 100.0 /100 | #12 | Exceptional 10.7% |
| Immigrants | Eastern Asia | 100.0 /100 | #13 | Exceptional 10.7% |
| Immigrants | China | 100.0 /100 | #14 | Exceptional 10.7% |
| Burmese | 100.0 /100 | #15 | Exceptional 10.7% |
| Okinawans | 100.0 /100 | #16 | Exceptional 10.8% |
| Indians (Asian) | 100.0 /100 | #17 | Exceptional 10.8% |
| Immigrants | Iran | 100.0 /100 | #18 | Exceptional 10.8% |
| Immigrants | Venezuela | 100.0 /100 | #19 | Exceptional 10.9% |
| Immigrants | Pakistan | 100.0 /100 | #20 | Exceptional 10.9% |
| Asians | 100.0 /100 | #21 | Exceptional 10.9% |
| Immigrants | Sri Lanka | 100.0 /100 | #22 | Exceptional 10.9% |
| Venezuelans | 100.0 /100 | #23 | Exceptional 11.0% |
| Immigrants | Argentina | 100.0 /100 | #24 | Exceptional 11.0% |
| Immigrants | Asia | 100.0 /100 | #25 | Exceptional 11.0% |