Japanese vs Trinidadian and Tobagonian Female Disability
COMPARE
Japanese
Trinidadian and Tobagonian
Female Disability
Female Disability Comparison
Japanese
Trinidadians and Tobagonians
12.6%
FEMALE DISABILITY
2.7/ 100
METRIC RATING
241st/ 347
METRIC RANK
12.3%
FEMALE DISABILITY
22.4/ 100
METRIC RATING
200th/ 347
METRIC RANK
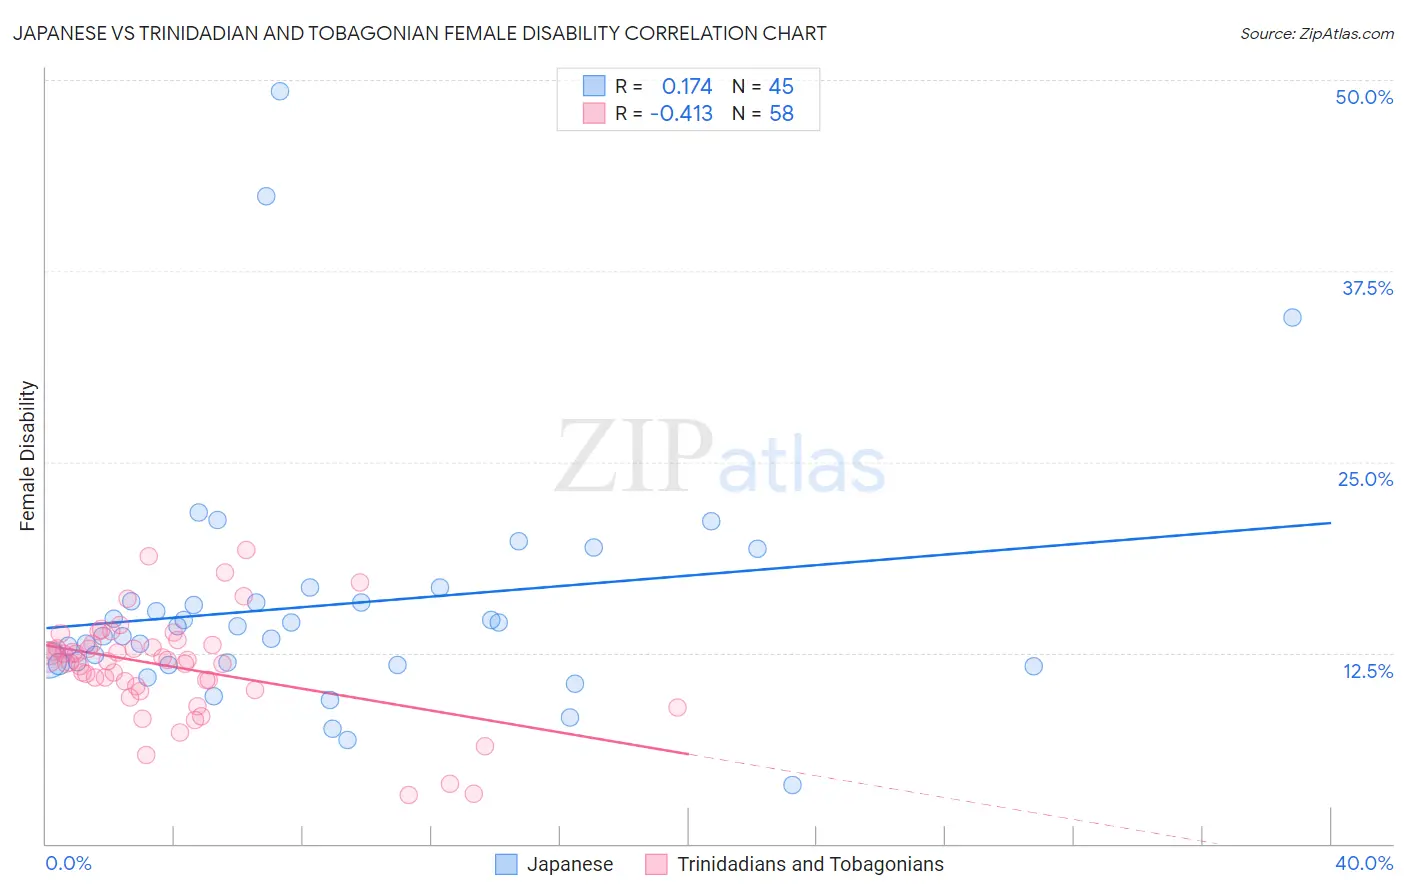
Japanese vs Trinidadian and Tobagonian Female Disability Correlation Chart
The statistical analysis conducted on geographies consisting of 249,148,020 people shows a poor positive correlation between the proportion of Japanese and percentage of females with a disability in the United States with a correlation coefficient (R) of 0.174 and weighted average of 12.6%. Similarly, the statistical analysis conducted on geographies consisting of 219,838,071 people shows a moderate negative correlation between the proportion of Trinidadians and Tobagonians and percentage of females with a disability in the United States with a correlation coefficient (R) of -0.413 and weighted average of 12.3%, a difference of 2.2%.
Female Disability Correlation Summary
| Measurement | Japanese | Trinidadian and Tobagonian |
| Minimum | 3.8% | 3.2% |
| Maximum | 49.3% | 19.2% |
| Range | 45.4% | 16.0% |
| Mean | 15.6% | 11.6% |
| Median | 14.2% | 12.0% |
| Interquartile 25% (IQ1) | 11.8% | 10.3% |
| Interquartile 75% (IQ3) | 16.3% | 13.0% |
| Interquartile Range (IQR) | 4.6% | 2.7% |
| Standard Deviation (Sample) | 8.2% | 3.3% |
| Standard Deviation (Population) | 8.1% | 3.3% |
Similar Demographics by Female Disability
Demographics Similar to Japanese by Female Disability
In terms of female disability, the demographic groups most similar to Japanese are Canadian (12.6%, a difference of 0.050%), Immigrants from Senegal (12.6%, a difference of 0.060%), Alsatian (12.6%, a difference of 0.070%), German Russian (12.6%, a difference of 0.17%), and Immigrants from Jamaica (12.6%, a difference of 0.21%).
| Demographics | Rating | Rank | Female Disability |
| Scandinavians | 5.3 /100 | #234 | Tragic 12.5% |
| Malaysians | 5.0 /100 | #235 | Tragic 12.5% |
| Immigrants | West Indies | 4.4 /100 | #236 | Tragic 12.6% |
| Slavs | 3.8 /100 | #237 | Tragic 12.6% |
| Yugoslavians | 3.7 /100 | #238 | Tragic 12.6% |
| Barbadians | 3.6 /100 | #239 | Tragic 12.6% |
| German Russians | 3.2 /100 | #240 | Tragic 12.6% |
| Japanese | 2.7 /100 | #241 | Tragic 12.6% |
| Canadians | 2.6 /100 | #242 | Tragic 12.6% |
| Immigrants | Senegal | 2.5 /100 | #243 | Tragic 12.6% |
| Alsatians | 2.5 /100 | #244 | Tragic 12.6% |
| Immigrants | Jamaica | 2.2 /100 | #245 | Tragic 12.6% |
| Spanish American Indians | 2.1 /100 | #246 | Tragic 12.6% |
| Menominee | 2.1 /100 | #247 | Tragic 12.6% |
| Carpatho Rusyns | 2.0 /100 | #248 | Tragic 12.6% |
Demographics Similar to Trinidadians and Tobagonians by Female Disability
In terms of female disability, the demographic groups most similar to Trinidadians and Tobagonians are Chinese (12.3%, a difference of 0.010%), Somali (12.3%, a difference of 0.040%), Immigrants from Barbados (12.3%, a difference of 0.070%), Immigrants from Zaire (12.3%, a difference of 0.080%), and Immigrants from Grenada (12.4%, a difference of 0.10%).
| Demographics | Rating | Rank | Female Disability |
| Northern Europeans | 27.5 /100 | #193 | Fair 12.3% |
| Ukrainians | 27.2 /100 | #194 | Fair 12.3% |
| Swedes | 26.6 /100 | #195 | Fair 12.3% |
| Immigrants | Panama | 25.5 /100 | #196 | Fair 12.3% |
| Hondurans | 25.4 /100 | #197 | Fair 12.3% |
| Mexican American Indians | 24.9 /100 | #198 | Fair 12.3% |
| Immigrants | Trinidad and Tobago | 24.7 /100 | #199 | Fair 12.3% |
| Trinidadians and Tobagonians | 22.4 /100 | #200 | Fair 12.3% |
| Chinese | 22.1 /100 | #201 | Fair 12.3% |
| Somalis | 21.5 /100 | #202 | Fair 12.3% |
| Immigrants | Barbados | 21.1 /100 | #203 | Fair 12.3% |
| Immigrants | Zaire | 20.9 /100 | #204 | Fair 12.3% |
| Immigrants | Grenada | 20.5 /100 | #205 | Fair 12.4% |
| Immigrants | Cuba | 20.2 /100 | #206 | Fair 12.4% |
| Croatians | 20.2 /100 | #207 | Fair 12.4% |