Syrian vs Immigrants from Belarus Female Disability
COMPARE
Syrian
Immigrants from Belarus
Female Disability
Female Disability Comparison
Syrians
Immigrants from Belarus
12.1%
FEMALE DISABILITY
76.9/ 100
METRIC RATING
154th/ 347
METRIC RANK
11.8%
FEMALE DISABILITY
97.8/ 100
METRIC RATING
113th/ 347
METRIC RANK
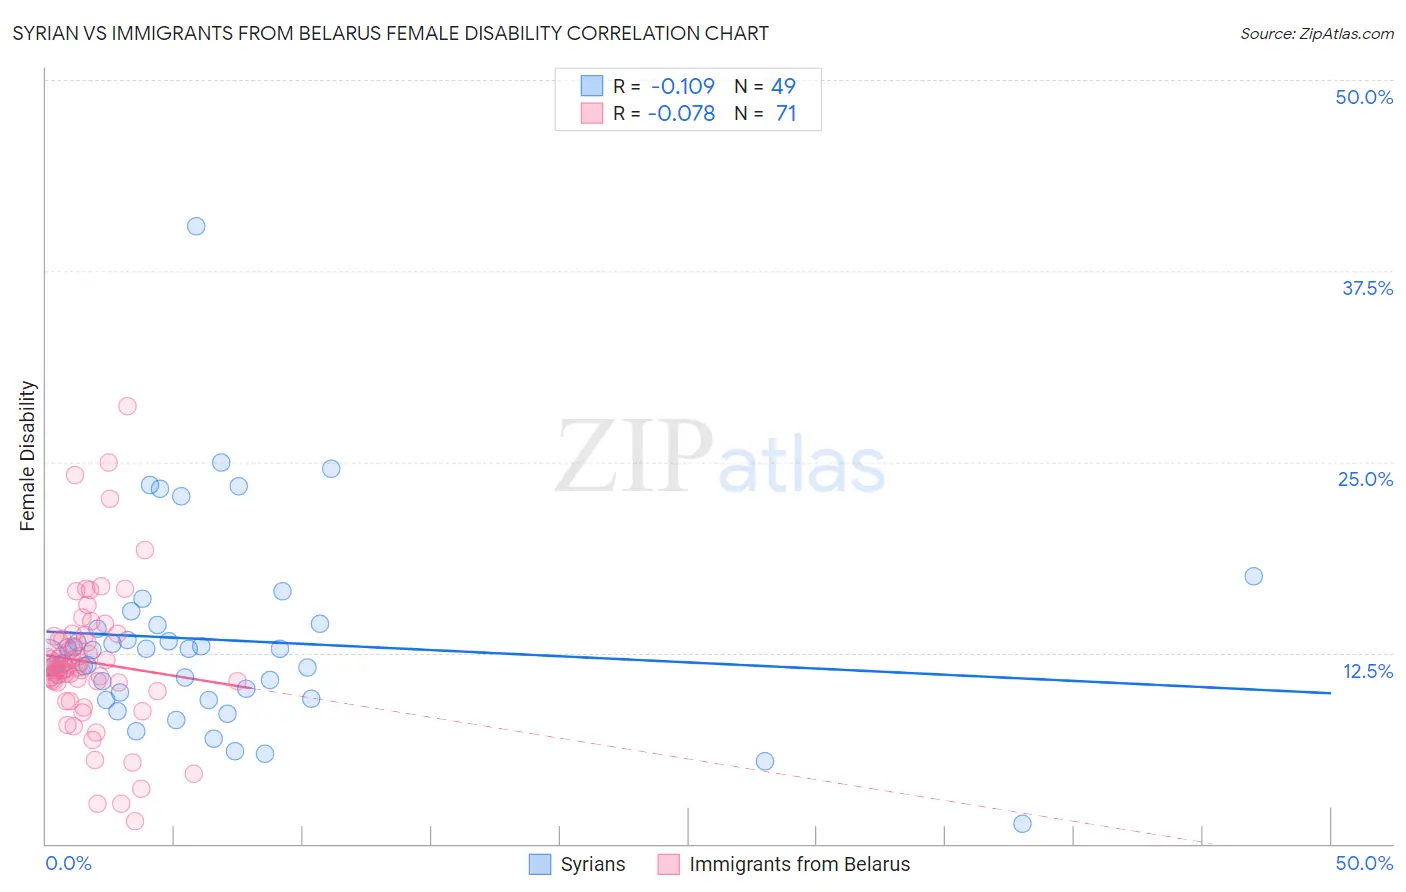
Syrian vs Immigrants from Belarus Female Disability Correlation Chart
The statistical analysis conducted on geographies consisting of 266,312,876 people shows a poor negative correlation between the proportion of Syrians and percentage of females with a disability in the United States with a correlation coefficient (R) of -0.109 and weighted average of 12.1%. Similarly, the statistical analysis conducted on geographies consisting of 150,193,098 people shows a slight negative correlation between the proportion of Immigrants from Belarus and percentage of females with a disability in the United States with a correlation coefficient (R) of -0.078 and weighted average of 11.8%, a difference of 2.5%.
Female Disability Correlation Summary
| Measurement | Syrian | Immigrants from Belarus |
| Minimum | 1.3% | 1.5% |
| Maximum | 40.4% | 28.7% |
| Range | 39.1% | 27.2% |
| Mean | 13.3% | 11.9% |
| Median | 12.7% | 11.5% |
| Interquartile 25% (IQ1) | 9.7% | 10.6% |
| Interquartile 75% (IQ3) | 14.4% | 13.6% |
| Interquartile Range (IQR) | 4.7% | 3.0% |
| Standard Deviation (Sample) | 6.5% | 4.7% |
| Standard Deviation (Population) | 6.4% | 4.7% |
Similar Demographics by Female Disability
Demographics Similar to Syrians by Female Disability
In terms of female disability, the demographic groups most similar to Syrians are Ghanaian (12.1%, a difference of 0.020%), Immigrants from Scotland (12.0%, a difference of 0.13%), Sudanese (12.0%, a difference of 0.13%), Moroccan (12.1%, a difference of 0.20%), and Icelander (12.0%, a difference of 0.22%).
| Demographics | Rating | Rank | Female Disability |
| Nigerians | 84.0 /100 | #147 | Excellent 12.0% |
| Immigrants | Kenya | 83.1 /100 | #148 | Excellent 12.0% |
| Greeks | 82.0 /100 | #149 | Excellent 12.0% |
| Immigrants | Moldova | 81.4 /100 | #150 | Excellent 12.0% |
| Icelanders | 80.7 /100 | #151 | Excellent 12.0% |
| Immigrants | Scotland | 79.3 /100 | #152 | Good 12.0% |
| Sudanese | 79.1 /100 | #153 | Good 12.0% |
| Syrians | 76.9 /100 | #154 | Good 12.1% |
| Ghanaians | 76.6 /100 | #155 | Good 12.1% |
| Moroccans | 72.9 /100 | #156 | Good 12.1% |
| Danes | 72.5 /100 | #157 | Good 12.1% |
| Immigrants | Middle Africa | 72.4 /100 | #158 | Good 12.1% |
| Immigrants | Central America | 67.7 /100 | #159 | Good 12.1% |
| Immigrants | Guatemala | 66.0 /100 | #160 | Good 12.1% |
| Guyanese | 64.7 /100 | #161 | Good 12.1% |
Demographics Similar to Immigrants from Belarus by Female Disability
In terms of female disability, the demographic groups most similar to Immigrants from Belarus are Immigrants from Bangladesh (11.8%, a difference of 0.010%), South African (11.8%, a difference of 0.030%), Brazilian (11.8%, a difference of 0.030%), Immigrants from Morocco (11.8%, a difference of 0.070%), and Costa Rican (11.7%, a difference of 0.13%).
| Demographics | Rating | Rank | Female Disability |
| Immigrants | Greece | 98.2 /100 | #106 | Exceptional 11.7% |
| Latvians | 98.2 /100 | #107 | Exceptional 11.7% |
| New Zealanders | 98.1 /100 | #108 | Exceptional 11.7% |
| Immigrants | Immigrants | 98.1 /100 | #109 | Exceptional 11.7% |
| Soviet Union | 98.1 /100 | #110 | Exceptional 11.7% |
| Costa Ricans | 98.1 /100 | #111 | Exceptional 11.7% |
| Immigrants | Bangladesh | 97.8 /100 | #112 | Exceptional 11.8% |
| Immigrants | Belarus | 97.8 /100 | #113 | Exceptional 11.8% |
| South Africans | 97.7 /100 | #114 | Exceptional 11.8% |
| Brazilians | 97.7 /100 | #115 | Exceptional 11.8% |
| Immigrants | Morocco | 97.6 /100 | #116 | Exceptional 11.8% |
| Immigrants | Eastern Europe | 97.2 /100 | #117 | Exceptional 11.8% |
| Immigrants | Nigeria | 97.2 /100 | #118 | Exceptional 11.8% |
| Immigrants | Uganda | 97.2 /100 | #119 | Exceptional 11.8% |
| Immigrants | Kazakhstan | 97.0 /100 | #120 | Exceptional 11.8% |