Palestinian vs Trinidadian and Tobagonian Female Disability
COMPARE
Palestinian
Trinidadian and Tobagonian
Female Disability
Female Disability Comparison
Palestinians
Trinidadians and Tobagonians
11.6%
FEMALE DISABILITY
99.6/ 100
METRIC RATING
85th/ 347
METRIC RANK
12.3%
FEMALE DISABILITY
22.4/ 100
METRIC RATING
200th/ 347
METRIC RANK
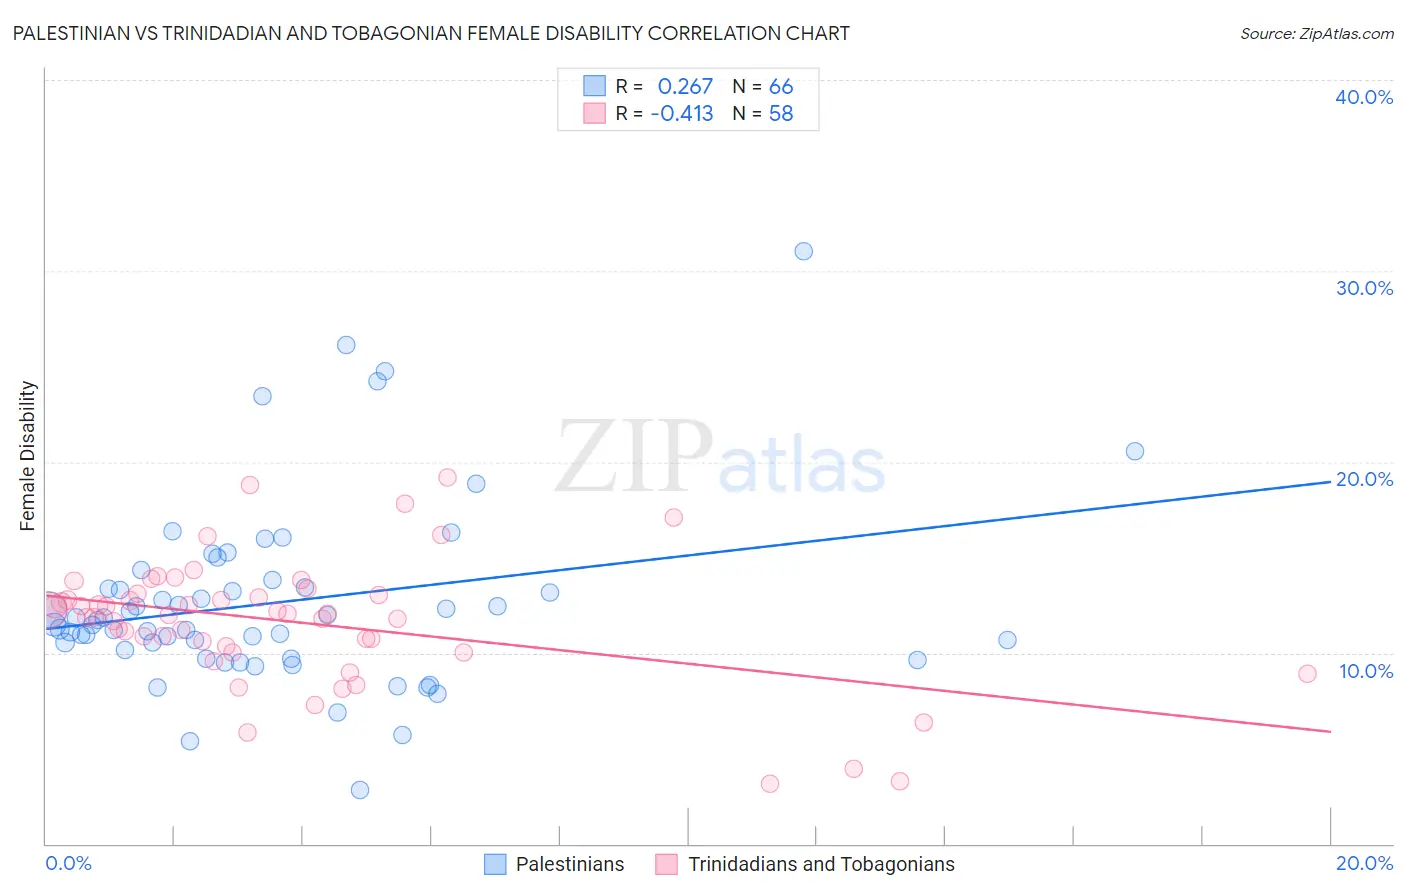
Palestinian vs Trinidadian and Tobagonian Female Disability Correlation Chart
The statistical analysis conducted on geographies consisting of 216,463,404 people shows a weak positive correlation between the proportion of Palestinians and percentage of females with a disability in the United States with a correlation coefficient (R) of 0.267 and weighted average of 11.6%. Similarly, the statistical analysis conducted on geographies consisting of 219,838,071 people shows a moderate negative correlation between the proportion of Trinidadians and Tobagonians and percentage of females with a disability in the United States with a correlation coefficient (R) of -0.413 and weighted average of 12.3%, a difference of 6.6%.
Female Disability Correlation Summary
| Measurement | Palestinian | Trinidadian and Tobagonian |
| Minimum | 2.8% | 3.2% |
| Maximum | 31.0% | 19.2% |
| Range | 28.2% | 16.0% |
| Mean | 12.7% | 11.6% |
| Median | 11.6% | 12.0% |
| Interquartile 25% (IQ1) | 10.1% | 10.3% |
| Interquartile 75% (IQ3) | 13.4% | 13.0% |
| Interquartile Range (IQR) | 3.3% | 2.7% |
| Standard Deviation (Sample) | 4.9% | 3.3% |
| Standard Deviation (Population) | 4.8% | 3.3% |
Similar Demographics by Female Disability
Demographics Similar to Palestinians by Female Disability
In terms of female disability, the demographic groups most similar to Palestinians are Immigrants from Cameroon (11.6%, a difference of 0.0%), Immigrants from Poland (11.6%, a difference of 0.030%), Immigrants from Serbia (11.6%, a difference of 0.060%), Immigrants from Denmark (11.6%, a difference of 0.070%), and Yup'ik (11.6%, a difference of 0.070%).
| Demographics | Rating | Rank | Female Disability |
| Immigrants | South Africa | 99.7 /100 | #78 | Exceptional 11.5% |
| Sierra Leoneans | 99.7 /100 | #79 | Exceptional 11.5% |
| Immigrants | Jordan | 99.7 /100 | #80 | Exceptional 11.5% |
| Eastern Europeans | 99.7 /100 | #81 | Exceptional 11.5% |
| Luxembourgers | 99.6 /100 | #82 | Exceptional 11.6% |
| Immigrants | Serbia | 99.6 /100 | #83 | Exceptional 11.6% |
| Immigrants | Poland | 99.6 /100 | #84 | Exceptional 11.6% |
| Palestinians | 99.6 /100 | #85 | Exceptional 11.6% |
| Immigrants | Cameroon | 99.6 /100 | #86 | Exceptional 11.6% |
| Immigrants | Denmark | 99.5 /100 | #87 | Exceptional 11.6% |
| Yup'ik | 99.5 /100 | #88 | Exceptional 11.6% |
| Vietnamese | 99.5 /100 | #89 | Exceptional 11.6% |
| Immigrants | Romania | 99.5 /100 | #90 | Exceptional 11.6% |
| Immigrants | Zimbabwe | 99.5 /100 | #91 | Exceptional 11.6% |
| Immigrants | Czechoslovakia | 99.5 /100 | #92 | Exceptional 11.6% |
Demographics Similar to Trinidadians and Tobagonians by Female Disability
In terms of female disability, the demographic groups most similar to Trinidadians and Tobagonians are Chinese (12.3%, a difference of 0.010%), Somali (12.3%, a difference of 0.040%), Immigrants from Barbados (12.3%, a difference of 0.070%), Immigrants from Zaire (12.3%, a difference of 0.080%), and Immigrants from Grenada (12.4%, a difference of 0.10%).
| Demographics | Rating | Rank | Female Disability |
| Northern Europeans | 27.5 /100 | #193 | Fair 12.3% |
| Ukrainians | 27.2 /100 | #194 | Fair 12.3% |
| Swedes | 26.6 /100 | #195 | Fair 12.3% |
| Immigrants | Panama | 25.5 /100 | #196 | Fair 12.3% |
| Hondurans | 25.4 /100 | #197 | Fair 12.3% |
| Mexican American Indians | 24.9 /100 | #198 | Fair 12.3% |
| Immigrants | Trinidad and Tobago | 24.7 /100 | #199 | Fair 12.3% |
| Trinidadians and Tobagonians | 22.4 /100 | #200 | Fair 12.3% |
| Chinese | 22.1 /100 | #201 | Fair 12.3% |
| Somalis | 21.5 /100 | #202 | Fair 12.3% |
| Immigrants | Barbados | 21.1 /100 | #203 | Fair 12.3% |
| Immigrants | Zaire | 20.9 /100 | #204 | Fair 12.3% |
| Immigrants | Grenada | 20.5 /100 | #205 | Fair 12.4% |
| Immigrants | Cuba | 20.2 /100 | #206 | Fair 12.4% |
| Croatians | 20.2 /100 | #207 | Fair 12.4% |