Belizean vs Trinidadian and Tobagonian Female Disability
COMPARE
Belizean
Trinidadian and Tobagonian
Female Disability
Female Disability Comparison
Belizeans
Trinidadians and Tobagonians
12.5%
FEMALE DISABILITY
9.3/ 100
METRIC RATING
224th/ 347
METRIC RANK
12.3%
FEMALE DISABILITY
22.4/ 100
METRIC RATING
200th/ 347
METRIC RANK
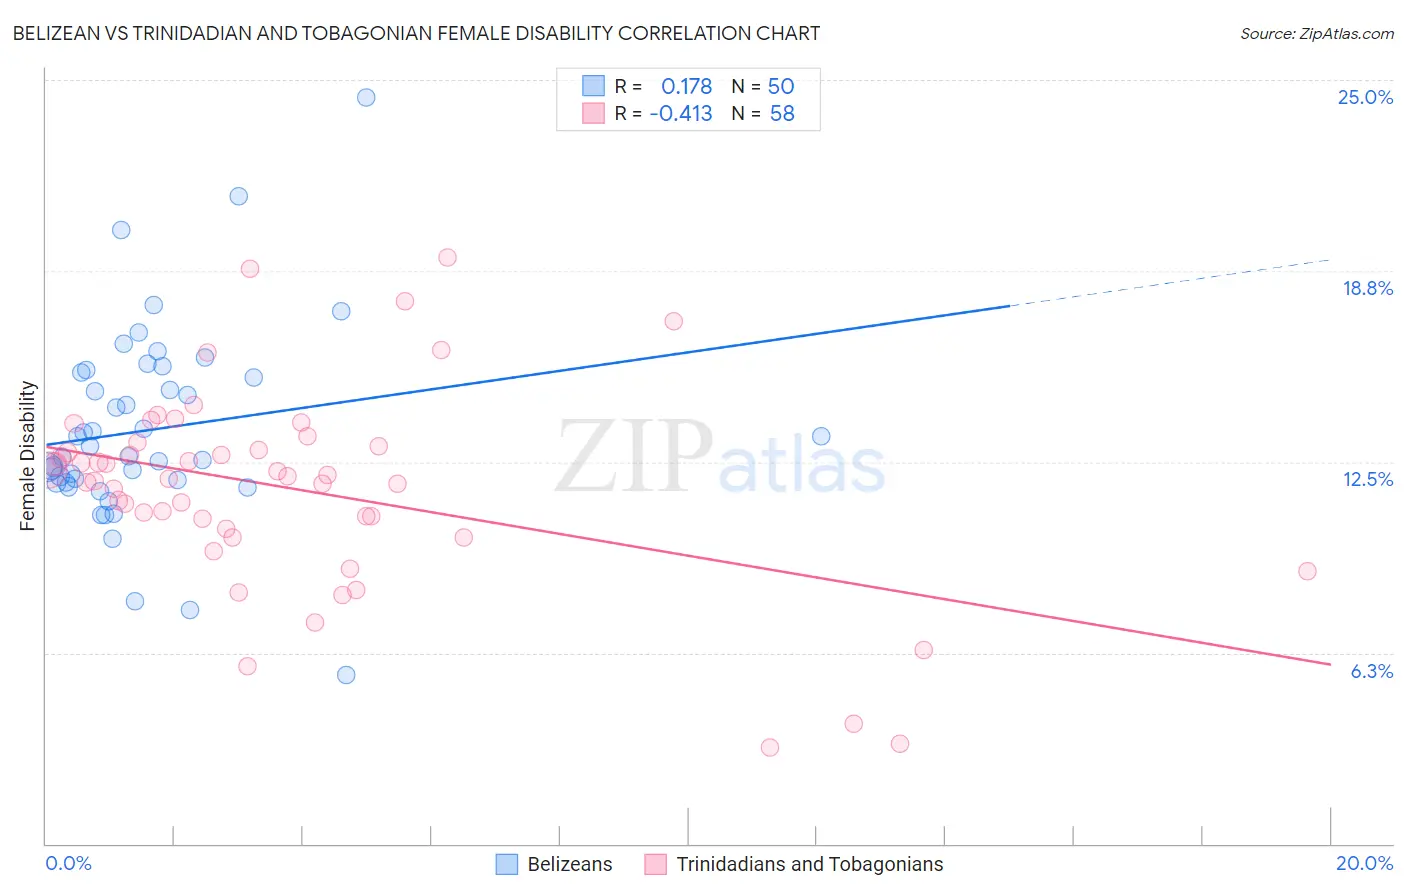
Belizean vs Trinidadian and Tobagonian Female Disability Correlation Chart
The statistical analysis conducted on geographies consisting of 144,186,476 people shows a poor positive correlation between the proportion of Belizeans and percentage of females with a disability in the United States with a correlation coefficient (R) of 0.178 and weighted average of 12.5%. Similarly, the statistical analysis conducted on geographies consisting of 219,838,071 people shows a moderate negative correlation between the proportion of Trinidadians and Tobagonians and percentage of females with a disability in the United States with a correlation coefficient (R) of -0.413 and weighted average of 12.3%, a difference of 0.96%.
Female Disability Correlation Summary
| Measurement | Belizean | Trinidadian and Tobagonian |
| Minimum | 5.5% | 3.2% |
| Maximum | 24.4% | 19.2% |
| Range | 18.9% | 16.0% |
| Mean | 13.5% | 11.6% |
| Median | 12.8% | 12.0% |
| Interquartile 25% (IQ1) | 11.8% | 10.3% |
| Interquartile 75% (IQ3) | 15.4% | 13.0% |
| Interquartile Range (IQR) | 3.6% | 2.7% |
| Standard Deviation (Sample) | 3.2% | 3.3% |
| Standard Deviation (Population) | 3.2% | 3.3% |
Similar Demographics by Female Disability
Demographics Similar to Belizeans by Female Disability
In terms of female disability, the demographic groups most similar to Belizeans are Guamanian/Chamorro (12.5%, a difference of 0.020%), Polish (12.5%, a difference of 0.10%), Italian (12.4%, a difference of 0.14%), Hispanic or Latino (12.5%, a difference of 0.15%), and Native Hawaiian (12.4%, a difference of 0.16%).
| Demographics | Rating | Rank | Female Disability |
| British | 12.7 /100 | #217 | Poor 12.4% |
| Immigrants | Bahamas | 12.5 /100 | #218 | Poor 12.4% |
| Europeans | 12.1 /100 | #219 | Poor 12.4% |
| Bahamians | 11.1 /100 | #220 | Poor 12.4% |
| Native Hawaiians | 10.8 /100 | #221 | Poor 12.4% |
| Italians | 10.7 /100 | #222 | Poor 12.4% |
| Guamanians/Chamorros | 9.5 /100 | #223 | Tragic 12.5% |
| Belizeans | 9.3 /100 | #224 | Tragic 12.5% |
| Poles | 8.4 /100 | #225 | Tragic 12.5% |
| Hispanics or Latinos | 8.0 /100 | #226 | Tragic 12.5% |
| Assyrians/Chaldeans/Syriacs | 8.0 /100 | #227 | Tragic 12.5% |
| Immigrants | Cambodia | 7.8 /100 | #228 | Tragic 12.5% |
| Hungarians | 7.2 /100 | #229 | Tragic 12.5% |
| Immigrants | Belize | 7.0 /100 | #230 | Tragic 12.5% |
| Belgians | 6.5 /100 | #231 | Tragic 12.5% |
Demographics Similar to Trinidadians and Tobagonians by Female Disability
In terms of female disability, the demographic groups most similar to Trinidadians and Tobagonians are Chinese (12.3%, a difference of 0.010%), Somali (12.3%, a difference of 0.040%), Immigrants from Barbados (12.3%, a difference of 0.070%), Immigrants from Zaire (12.3%, a difference of 0.080%), and Immigrants from Grenada (12.4%, a difference of 0.10%).
| Demographics | Rating | Rank | Female Disability |
| Northern Europeans | 27.5 /100 | #193 | Fair 12.3% |
| Ukrainians | 27.2 /100 | #194 | Fair 12.3% |
| Swedes | 26.6 /100 | #195 | Fair 12.3% |
| Immigrants | Panama | 25.5 /100 | #196 | Fair 12.3% |
| Hondurans | 25.4 /100 | #197 | Fair 12.3% |
| Mexican American Indians | 24.9 /100 | #198 | Fair 12.3% |
| Immigrants | Trinidad and Tobago | 24.7 /100 | #199 | Fair 12.3% |
| Trinidadians and Tobagonians | 22.4 /100 | #200 | Fair 12.3% |
| Chinese | 22.1 /100 | #201 | Fair 12.3% |
| Somalis | 21.5 /100 | #202 | Fair 12.3% |
| Immigrants | Barbados | 21.1 /100 | #203 | Fair 12.3% |
| Immigrants | Zaire | 20.9 /100 | #204 | Fair 12.3% |
| Immigrants | Grenada | 20.5 /100 | #205 | Fair 12.4% |
| Immigrants | Cuba | 20.2 /100 | #206 | Fair 12.4% |
| Croatians | 20.2 /100 | #207 | Fair 12.4% |