Immigrants from South Central Asia vs Alsatian Disability
COMPARE
Immigrants from South Central Asia
Alsatian
Disability
Disability Comparison
Immigrants from South Central Asia
Alsatians
9.9%
DISABILITY
100.0/ 100
METRIC RATING
6th/ 347
METRIC RANK
12.1%
DISABILITY
3.3/ 100
METRIC RATING
227th/ 347
METRIC RANK
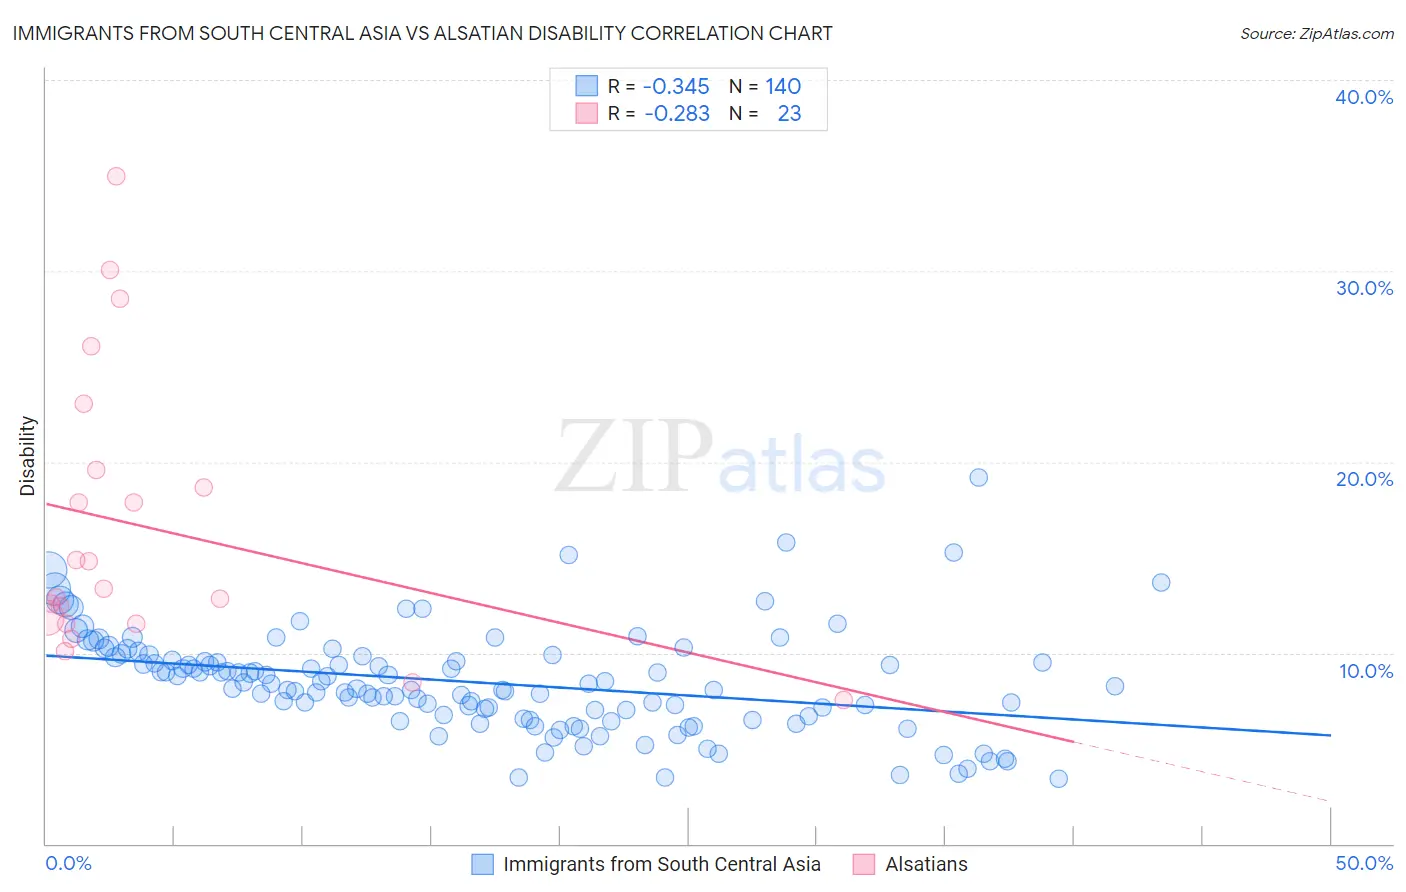
Immigrants from South Central Asia vs Alsatian Disability Correlation Chart
The statistical analysis conducted on geographies consisting of 473,067,496 people shows a mild negative correlation between the proportion of Immigrants from South Central Asia and percentage of population with a disability in the United States with a correlation coefficient (R) of -0.345 and weighted average of 9.9%. Similarly, the statistical analysis conducted on geographies consisting of 82,681,540 people shows a weak negative correlation between the proportion of Alsatians and percentage of population with a disability in the United States with a correlation coefficient (R) of -0.283 and weighted average of 12.1%, a difference of 22.0%.
Disability Correlation Summary
| Measurement | Immigrants from South Central Asia | Alsatian |
| Minimum | 3.4% | 7.5% |
| Maximum | 19.2% | 34.9% |
| Range | 15.8% | 27.4% |
| Mean | 8.5% | 16.6% |
| Median | 8.3% | 13.4% |
| Interquartile 25% (IQ1) | 6.7% | 11.5% |
| Interquartile 75% (IQ3) | 9.8% | 19.6% |
| Interquartile Range (IQR) | 3.1% | 8.0% |
| Standard Deviation (Sample) | 2.7% | 7.3% |
| Standard Deviation (Population) | 2.7% | 7.2% |
Similar Demographics by Disability
Demographics Similar to Immigrants from South Central Asia by Disability
In terms of disability, the demographic groups most similar to Immigrants from South Central Asia are Immigrants from Singapore (10.0%, a difference of 0.31%), Bolivian (10.0%, a difference of 0.54%), Immigrants from Bolivia (9.9%, a difference of 0.84%), Immigrants from Hong Kong (10.0%, a difference of 0.84%), and Immigrants from China (10.1%, a difference of 1.7%).
| Demographics | Rating | Rank | Disability |
| Immigrants | India | 100.0 /100 | #1 | Exceptional 9.5% |
| Filipinos | 100.0 /100 | #2 | Exceptional 9.6% |
| Immigrants | Taiwan | 100.0 /100 | #3 | Exceptional 9.6% |
| Thais | 100.0 /100 | #4 | Exceptional 9.7% |
| Immigrants | Bolivia | 100.0 /100 | #5 | Exceptional 9.9% |
| Immigrants | South Central Asia | 100.0 /100 | #6 | Exceptional 9.9% |
| Immigrants | Singapore | 100.0 /100 | #7 | Exceptional 10.0% |
| Bolivians | 100.0 /100 | #8 | Exceptional 10.0% |
| Immigrants | Hong Kong | 100.0 /100 | #9 | Exceptional 10.0% |
| Immigrants | China | 100.0 /100 | #10 | Exceptional 10.1% |
| Iranians | 100.0 /100 | #11 | Exceptional 10.1% |
| Immigrants | Israel | 100.0 /100 | #12 | Exceptional 10.1% |
| Immigrants | Eastern Asia | 100.0 /100 | #13 | Exceptional 10.2% |
| Immigrants | Korea | 100.0 /100 | #14 | Exceptional 10.2% |
| Okinawans | 100.0 /100 | #15 | Exceptional 10.3% |
Demographics Similar to Alsatians by Disability
In terms of disability, the demographic groups most similar to Alsatians are Jamaican (12.1%, a difference of 0.010%), Senegalese (12.1%, a difference of 0.060%), Mexican (12.1%, a difference of 0.14%), West Indian (12.2%, a difference of 0.14%), and Inupiat (12.2%, a difference of 0.16%).
| Demographics | Rating | Rank | Disability |
| Immigrants | Bahamas | 4.7 /100 | #220 | Tragic 12.1% |
| Northern Europeans | 4.2 /100 | #221 | Tragic 12.1% |
| Spanish American Indians | 4.1 /100 | #222 | Tragic 12.1% |
| Hispanics or Latinos | 3.9 /100 | #223 | Tragic 12.1% |
| Mexicans | 3.7 /100 | #224 | Tragic 12.1% |
| Senegalese | 3.5 /100 | #225 | Tragic 12.1% |
| Jamaicans | 3.3 /100 | #226 | Tragic 12.1% |
| Alsatians | 3.3 /100 | #227 | Tragic 12.1% |
| West Indians | 2.9 /100 | #228 | Tragic 12.2% |
| Inupiat | 2.8 /100 | #229 | Tragic 12.2% |
| Samoans | 2.6 /100 | #230 | Tragic 12.2% |
| Malaysians | 2.5 /100 | #231 | Tragic 12.2% |
| Italians | 2.5 /100 | #232 | Tragic 12.2% |
| Bahamians | 2.3 /100 | #233 | Tragic 12.2% |
| Japanese | 2.3 /100 | #234 | Tragic 12.2% |