Immigrants from Zaire vs Alsatian Disability
COMPARE
Immigrants from Zaire
Alsatian
Disability
Disability Comparison
Immigrants from Zaire
Alsatians
11.9%
DISABILITY
21.8/ 100
METRIC RATING
189th/ 347
METRIC RANK
12.1%
DISABILITY
3.3/ 100
METRIC RATING
227th/ 347
METRIC RANK
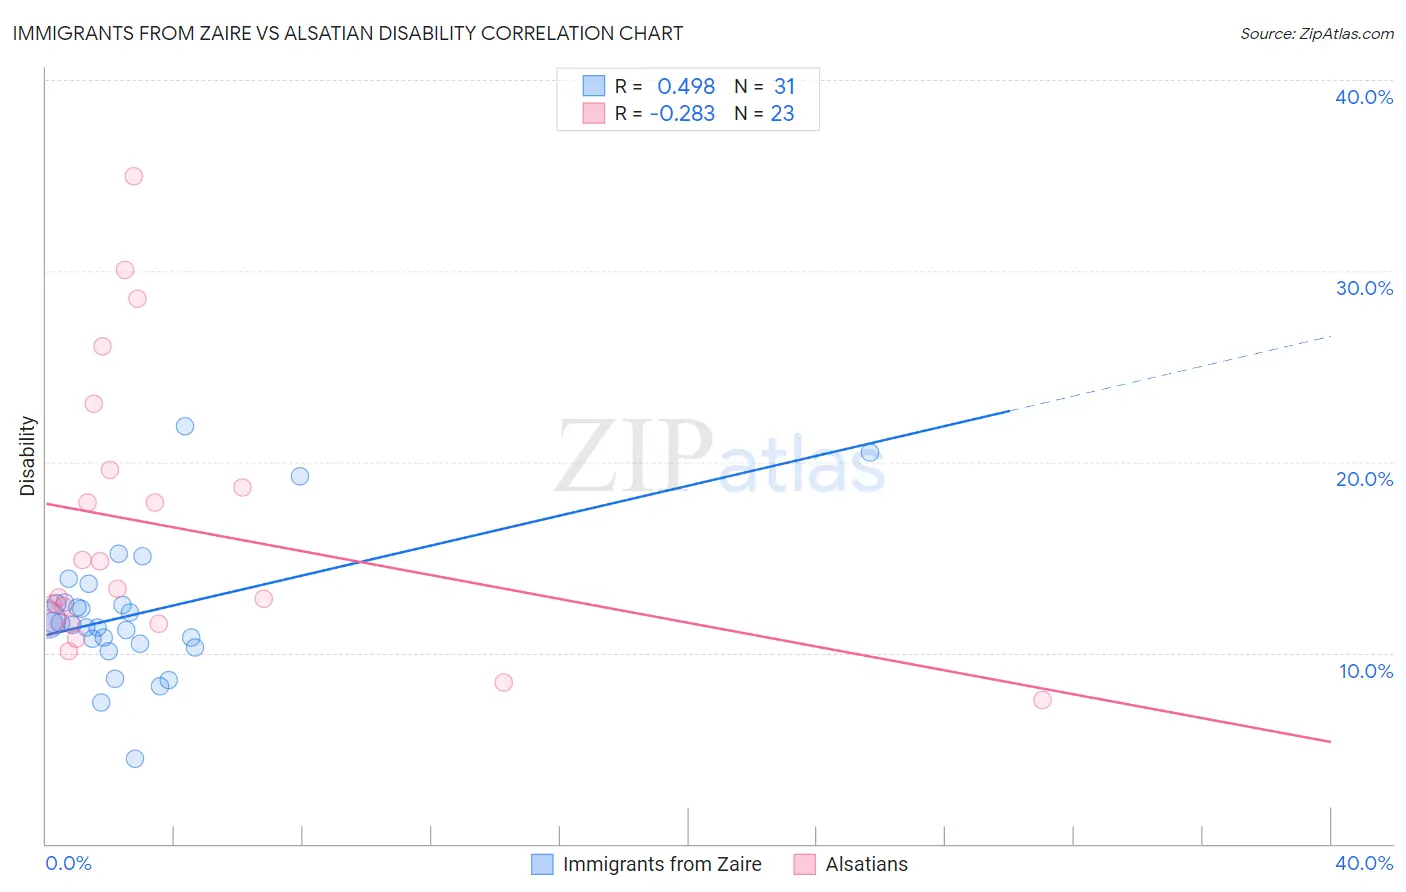
Immigrants from Zaire vs Alsatian Disability Correlation Chart
The statistical analysis conducted on geographies consisting of 107,255,080 people shows a moderate positive correlation between the proportion of Immigrants from Zaire and percentage of population with a disability in the United States with a correlation coefficient (R) of 0.498 and weighted average of 11.9%. Similarly, the statistical analysis conducted on geographies consisting of 82,681,540 people shows a weak negative correlation between the proportion of Alsatians and percentage of population with a disability in the United States with a correlation coefficient (R) of -0.283 and weighted average of 12.1%, a difference of 2.3%.
Disability Correlation Summary
| Measurement | Immigrants from Zaire | Alsatian |
| Minimum | 4.4% | 7.5% |
| Maximum | 21.9% | 34.9% |
| Range | 17.5% | 27.4% |
| Mean | 12.1% | 16.6% |
| Median | 11.6% | 13.4% |
| Interquartile 25% (IQ1) | 10.5% | 11.5% |
| Interquartile 75% (IQ3) | 12.6% | 19.6% |
| Interquartile Range (IQR) | 2.1% | 8.0% |
| Standard Deviation (Sample) | 3.6% | 7.3% |
| Standard Deviation (Population) | 3.5% | 7.2% |
Similar Demographics by Disability
Demographics Similar to Immigrants from Zaire by Disability
In terms of disability, the demographic groups most similar to Immigrants from Zaire are Immigrants from West Indies (11.9%, a difference of 0.050%), Immigrants from Mexico (11.9%, a difference of 0.12%), Ute (11.9%, a difference of 0.16%), Lithuanian (11.9%, a difference of 0.21%), and Immigrants from Bosnia and Herzegovina (11.9%, a difference of 0.26%).
| Demographics | Rating | Rank | Disability |
| Icelanders | 34.0 /100 | #182 | Fair 11.8% |
| Hondurans | 31.2 /100 | #183 | Fair 11.8% |
| Iraqis | 30.0 /100 | #184 | Fair 11.8% |
| Immigrants | Burma/Myanmar | 28.5 /100 | #185 | Fair 11.8% |
| Immigrants | Scotland | 28.2 /100 | #186 | Fair 11.8% |
| Lebanese | 27.9 /100 | #187 | Fair 11.8% |
| Immigrants | Mexico | 23.8 /100 | #188 | Fair 11.9% |
| Immigrants | Zaire | 21.8 /100 | #189 | Fair 11.9% |
| Immigrants | West Indies | 21.1 /100 | #190 | Fair 11.9% |
| Ute | 19.5 /100 | #191 | Poor 11.9% |
| Lithuanians | 18.8 /100 | #192 | Poor 11.9% |
| Immigrants | Bosnia and Herzegovina | 18.0 /100 | #193 | Poor 11.9% |
| Somalis | 17.3 /100 | #194 | Poor 11.9% |
| Barbadians | 15.8 /100 | #195 | Poor 11.9% |
| Serbians | 15.4 /100 | #196 | Poor 11.9% |
Demographics Similar to Alsatians by Disability
In terms of disability, the demographic groups most similar to Alsatians are Jamaican (12.1%, a difference of 0.010%), Senegalese (12.1%, a difference of 0.060%), Mexican (12.1%, a difference of 0.14%), West Indian (12.2%, a difference of 0.14%), and Inupiat (12.2%, a difference of 0.16%).
| Demographics | Rating | Rank | Disability |
| Immigrants | Bahamas | 4.7 /100 | #220 | Tragic 12.1% |
| Northern Europeans | 4.2 /100 | #221 | Tragic 12.1% |
| Spanish American Indians | 4.1 /100 | #222 | Tragic 12.1% |
| Hispanics or Latinos | 3.9 /100 | #223 | Tragic 12.1% |
| Mexicans | 3.7 /100 | #224 | Tragic 12.1% |
| Senegalese | 3.5 /100 | #225 | Tragic 12.1% |
| Jamaicans | 3.3 /100 | #226 | Tragic 12.1% |
| Alsatians | 3.3 /100 | #227 | Tragic 12.1% |
| West Indians | 2.9 /100 | #228 | Tragic 12.2% |
| Inupiat | 2.8 /100 | #229 | Tragic 12.2% |
| Samoans | 2.6 /100 | #230 | Tragic 12.2% |
| Malaysians | 2.5 /100 | #231 | Tragic 12.2% |
| Italians | 2.5 /100 | #232 | Tragic 12.2% |
| Bahamians | 2.3 /100 | #233 | Tragic 12.2% |
| Japanese | 2.3 /100 | #234 | Tragic 12.2% |