Spanish American vs Immigrants from the Azores Disability
COMPARE
Spanish American
Immigrants from the Azores
Disability
Disability Comparison
Spanish Americans
Immigrants from the Azores
13.6%
DISABILITY
0.0/ 100
METRIC RATING
312th/ 347
METRIC RANK
14.2%
DISABILITY
0.0/ 100
METRIC RATING
328th/ 347
METRIC RANK
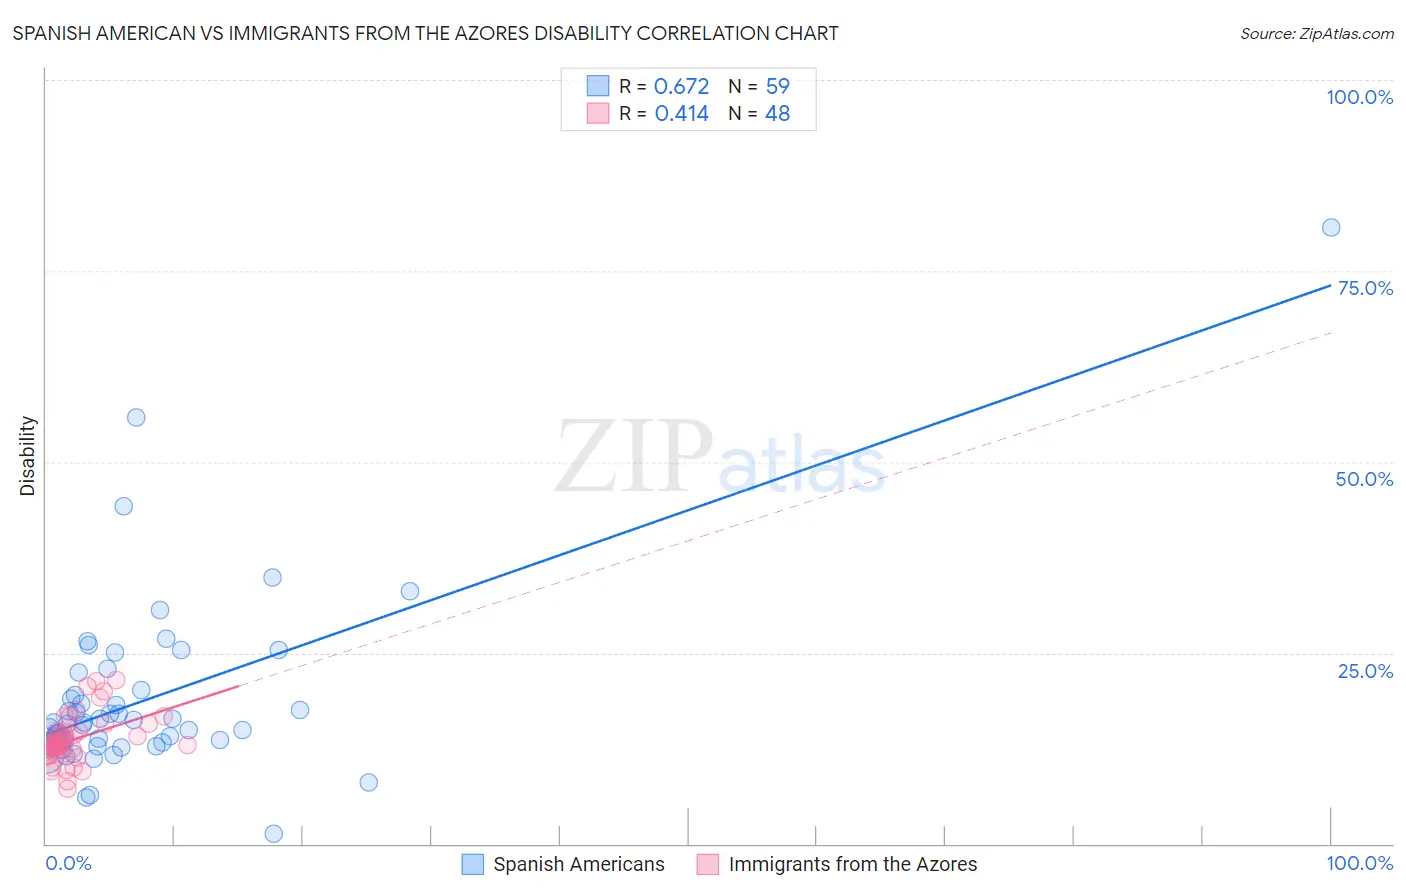
Spanish American vs Immigrants from the Azores Disability Correlation Chart
The statistical analysis conducted on geographies consisting of 103,168,597 people shows a significant positive correlation between the proportion of Spanish Americans and percentage of population with a disability in the United States with a correlation coefficient (R) of 0.672 and weighted average of 13.6%. Similarly, the statistical analysis conducted on geographies consisting of 46,257,178 people shows a moderate positive correlation between the proportion of Immigrants from the Azores and percentage of population with a disability in the United States with a correlation coefficient (R) of 0.414 and weighted average of 14.2%, a difference of 3.8%.
Disability Correlation Summary
| Measurement | Spanish American | Immigrants from the Azores |
| Minimum | 1.3% | 7.2% |
| Maximum | 80.7% | 21.5% |
| Range | 79.5% | 14.3% |
| Mean | 18.8% | 13.7% |
| Median | 15.7% | 13.1% |
| Interquartile 25% (IQ1) | 13.3% | 12.0% |
| Interquartile 75% (IQ3) | 20.1% | 14.8% |
| Interquartile Range (IQR) | 6.8% | 2.7% |
| Standard Deviation (Sample) | 12.0% | 3.2% |
| Standard Deviation (Population) | 11.9% | 3.1% |
Demographics Similar to Spanish Americans and Immigrants from the Azores by Disability
In terms of disability, the demographic groups most similar to Spanish Americans are Delaware (13.6%, a difference of 0.24%), Blackfeet (13.6%, a difference of 0.28%), Cree (13.7%, a difference of 0.35%), Black/African American (13.7%, a difference of 0.39%), and Puget Sound Salish (13.7%, a difference of 0.39%). Similarly, the demographic groups most similar to Immigrants from the Azores are Ottawa (14.2%, a difference of 0.0%), Osage (14.2%, a difference of 0.020%), Native/Alaskan (14.2%, a difference of 0.060%), Chippewa (14.1%, a difference of 0.10%), and Potawatomi (14.2%, a difference of 0.12%).
| Demographics | Rating | Rank | Disability |
| Blackfeet | 0.0 /100 | #310 | Tragic 13.6% |
| Delaware | 0.0 /100 | #311 | Tragic 13.6% |
| Spanish Americans | 0.0 /100 | #312 | Tragic 13.6% |
| Cree | 0.0 /100 | #313 | Tragic 13.7% |
| Blacks/African Americans | 0.0 /100 | #314 | Tragic 13.7% |
| Puget Sound Salish | 0.0 /100 | #315 | Tragic 13.7% |
| Pima | 0.0 /100 | #316 | Tragic 13.7% |
| Immigrants | Cabo Verde | 0.0 /100 | #317 | Tragic 13.7% |
| Menominee | 0.0 /100 | #318 | Tragic 13.8% |
| Iroquois | 0.0 /100 | #319 | Tragic 13.8% |
| Apache | 0.0 /100 | #320 | Tragic 13.9% |
| Paiute | 0.0 /100 | #321 | Tragic 13.9% |
| Americans | 0.0 /100 | #322 | Tragic 13.9% |
| Comanche | 0.0 /100 | #323 | Tragic 14.1% |
| Chippewa | 0.0 /100 | #324 | Tragic 14.1% |
| Natives/Alaskans | 0.0 /100 | #325 | Tragic 14.2% |
| Osage | 0.0 /100 | #326 | Tragic 14.2% |
| Ottawa | 0.0 /100 | #327 | Tragic 14.2% |
| Immigrants | Azores | 0.0 /100 | #328 | Tragic 14.2% |
| Potawatomi | 0.0 /100 | #329 | Tragic 14.2% |
| Navajo | 0.0 /100 | #330 | Tragic 14.3% |