Spanish American vs Immigrants from Uganda Disability
COMPARE
Spanish American
Immigrants from Uganda
Disability
Disability Comparison
Spanish Americans
Immigrants from Uganda
13.6%
DISABILITY
0.0/ 100
METRIC RATING
312th/ 347
METRIC RANK
11.3%
DISABILITY
95.7/ 100
METRIC RATING
109th/ 347
METRIC RANK
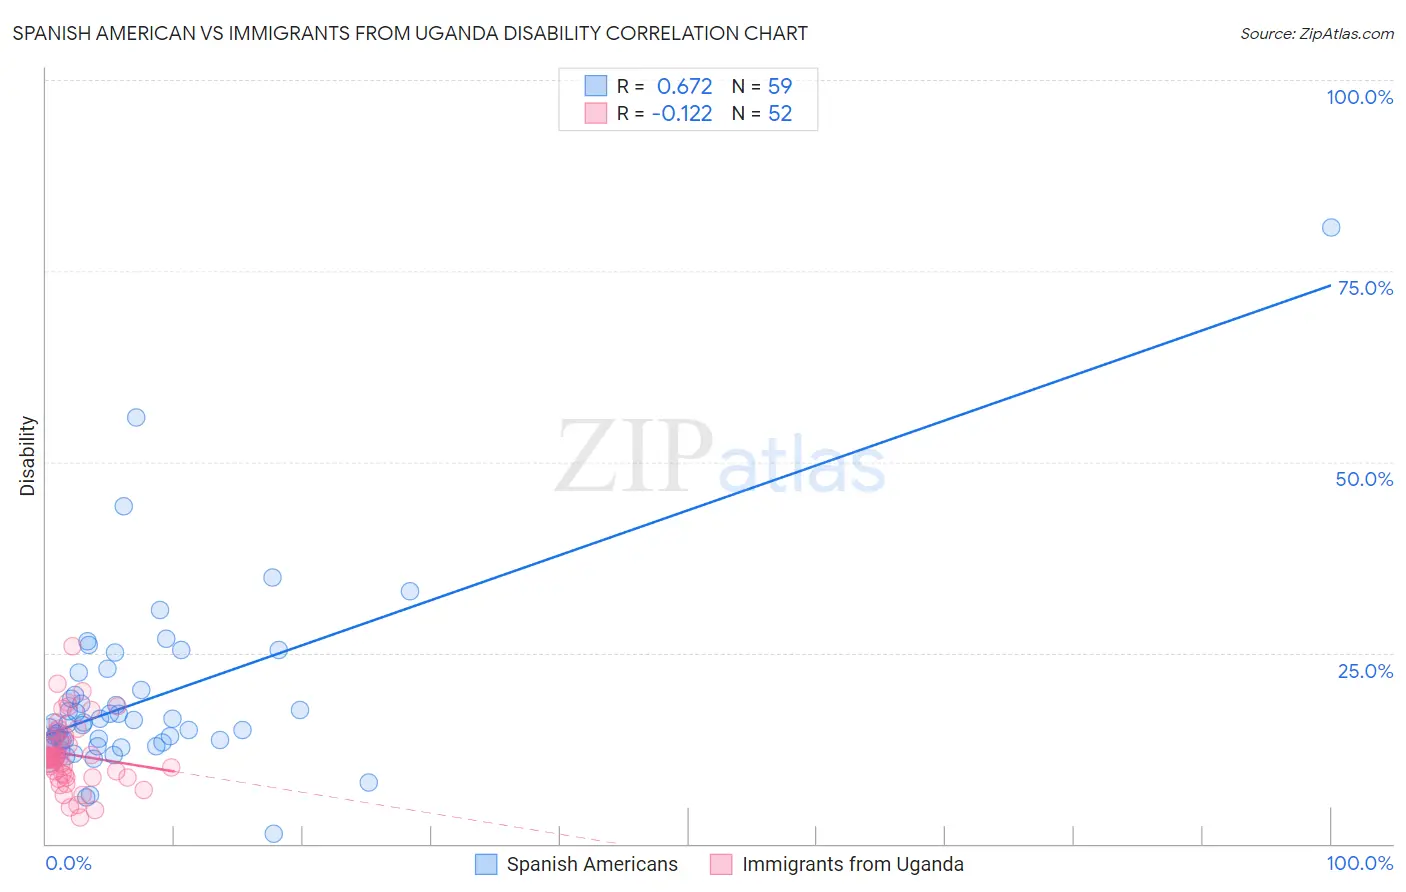
Spanish American vs Immigrants from Uganda Disability Correlation Chart
The statistical analysis conducted on geographies consisting of 103,168,597 people shows a significant positive correlation between the proportion of Spanish Americans and percentage of population with a disability in the United States with a correlation coefficient (R) of 0.672 and weighted average of 13.6%. Similarly, the statistical analysis conducted on geographies consisting of 125,981,344 people shows a poor negative correlation between the proportion of Immigrants from Uganda and percentage of population with a disability in the United States with a correlation coefficient (R) of -0.122 and weighted average of 11.3%, a difference of 20.8%.
Disability Correlation Summary
| Measurement | Spanish American | Immigrants from Uganda |
| Minimum | 1.3% | 3.5% |
| Maximum | 80.7% | 25.9% |
| Range | 79.5% | 22.4% |
| Mean | 18.8% | 11.7% |
| Median | 15.7% | 11.3% |
| Interquartile 25% (IQ1) | 13.3% | 8.8% |
| Interquartile 75% (IQ3) | 20.1% | 13.9% |
| Interquartile Range (IQR) | 6.8% | 5.1% |
| Standard Deviation (Sample) | 12.0% | 4.4% |
| Standard Deviation (Population) | 11.9% | 4.4% |
Similar Demographics by Disability
Demographics Similar to Spanish Americans by Disability
In terms of disability, the demographic groups most similar to Spanish Americans are Delaware (13.6%, a difference of 0.24%), Blackfeet (13.6%, a difference of 0.28%), Cree (13.7%, a difference of 0.35%), Black/African American (13.7%, a difference of 0.39%), and Puget Sound Salish (13.7%, a difference of 0.39%).
| Demographics | Rating | Rank | Disability |
| French Canadians | 0.0 /100 | #305 | Tragic 13.4% |
| Cape Verdeans | 0.0 /100 | #306 | Tragic 13.5% |
| Shoshone | 0.0 /100 | #307 | Tragic 13.5% |
| French American Indians | 0.0 /100 | #308 | Tragic 13.5% |
| Tlingit-Haida | 0.0 /100 | #309 | Tragic 13.5% |
| Blackfeet | 0.0 /100 | #310 | Tragic 13.6% |
| Delaware | 0.0 /100 | #311 | Tragic 13.6% |
| Spanish Americans | 0.0 /100 | #312 | Tragic 13.6% |
| Cree | 0.0 /100 | #313 | Tragic 13.7% |
| Blacks/African Americans | 0.0 /100 | #314 | Tragic 13.7% |
| Puget Sound Salish | 0.0 /100 | #315 | Tragic 13.7% |
| Pima | 0.0 /100 | #316 | Tragic 13.7% |
| Immigrants | Cabo Verde | 0.0 /100 | #317 | Tragic 13.7% |
| Menominee | 0.0 /100 | #318 | Tragic 13.8% |
| Iroquois | 0.0 /100 | #319 | Tragic 13.8% |
Demographics Similar to Immigrants from Uganda by Disability
In terms of disability, the demographic groups most similar to Immigrants from Uganda are Immigrants from Denmark (11.3%, a difference of 0.020%), Immigrants from Nigeria (11.3%, a difference of 0.080%), Immigrants from South Eastern Asia (11.3%, a difference of 0.080%), Nicaraguan (11.3%, a difference of 0.16%), and Immigrants from Eastern Europe (11.3%, a difference of 0.18%).
| Demographics | Rating | Rank | Disability |
| Immigrants | Eastern Africa | 96.7 /100 | #102 | Exceptional 11.3% |
| Immigrants | Uruguay | 96.4 /100 | #103 | Exceptional 11.3% |
| Immigrants | Immigrants | 96.4 /100 | #104 | Exceptional 11.3% |
| Immigrants | Kazakhstan | 96.4 /100 | #105 | Exceptional 11.3% |
| Immigrants | Eastern Europe | 96.3 /100 | #106 | Exceptional 11.3% |
| Nicaraguans | 96.2 /100 | #107 | Exceptional 11.3% |
| Immigrants | Nigeria | 96.0 /100 | #108 | Exceptional 11.3% |
| Immigrants | Uganda | 95.7 /100 | #109 | Exceptional 11.3% |
| Immigrants | Denmark | 95.6 /100 | #110 | Exceptional 11.3% |
| Immigrants | South Eastern Asia | 95.4 /100 | #111 | Exceptional 11.3% |
| Immigrants | Uzbekistan | 94.9 /100 | #112 | Exceptional 11.3% |
| Guyanese | 94.7 /100 | #113 | Exceptional 11.3% |
| Immigrants | Syria | 94.7 /100 | #114 | Exceptional 11.3% |
| Immigrants | Philippines | 94.6 /100 | #115 | Exceptional 11.3% |
| Immigrants | Northern Europe | 94.1 /100 | #116 | Exceptional 11.3% |