Spanish American vs Ethiopian Disability
COMPARE
Spanish American
Ethiopian
Disability
Disability Comparison
Spanish Americans
Ethiopians
13.6%
DISABILITY
0.0/ 100
METRIC RATING
312th/ 347
METRIC RANK
10.7%
DISABILITY
100.0/ 100
METRIC RATING
36th/ 347
METRIC RANK
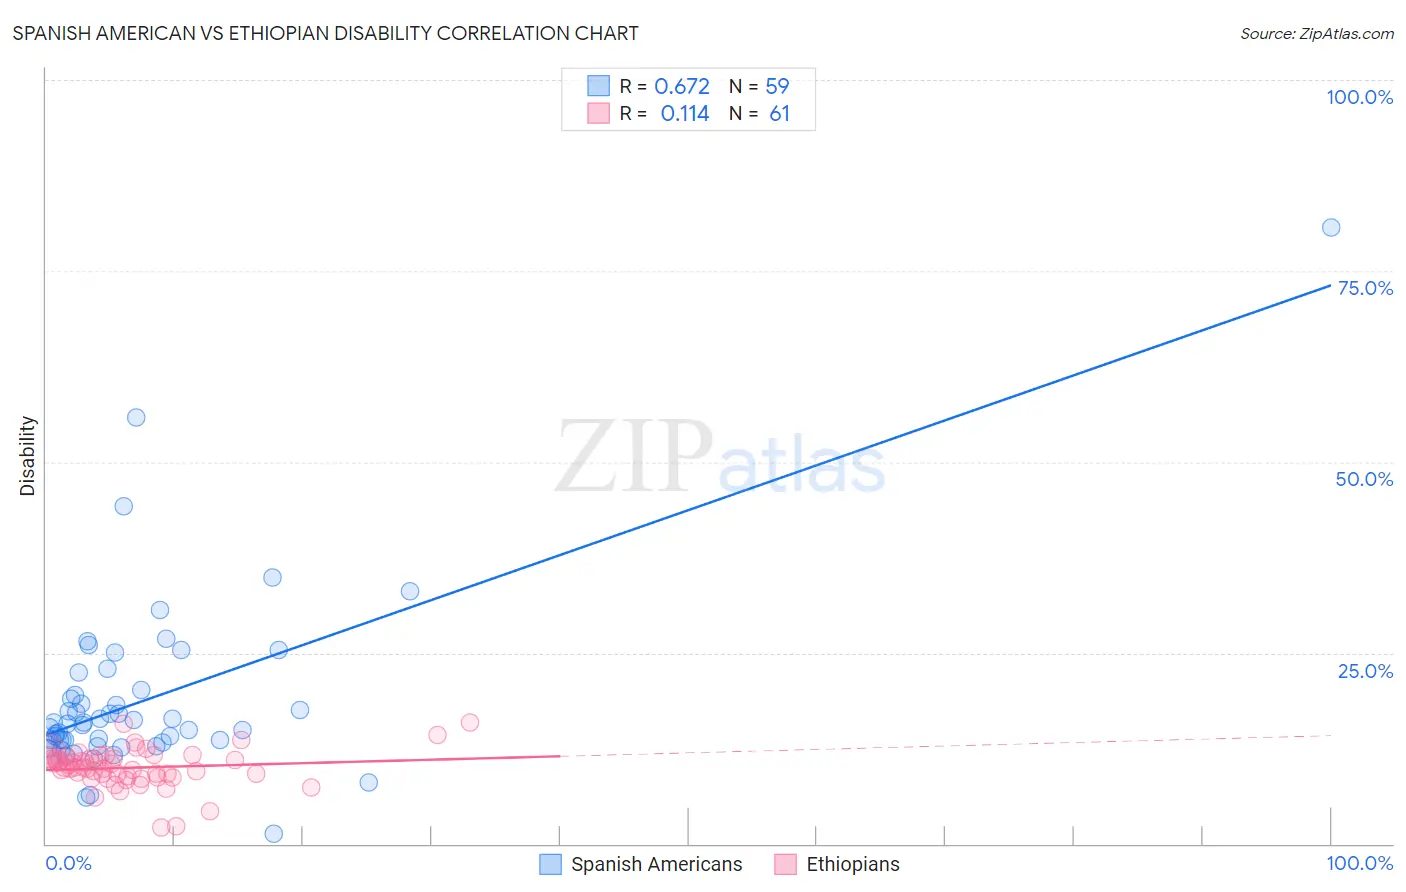
Spanish American vs Ethiopian Disability Correlation Chart
The statistical analysis conducted on geographies consisting of 103,168,597 people shows a significant positive correlation between the proportion of Spanish Americans and percentage of population with a disability in the United States with a correlation coefficient (R) of 0.672 and weighted average of 13.6%. Similarly, the statistical analysis conducted on geographies consisting of 223,240,308 people shows a poor positive correlation between the proportion of Ethiopians and percentage of population with a disability in the United States with a correlation coefficient (R) of 0.114 and weighted average of 10.7%, a difference of 27.5%.
Disability Correlation Summary
| Measurement | Spanish American | Ethiopian |
| Minimum | 1.3% | 2.1% |
| Maximum | 80.7% | 15.9% |
| Range | 79.5% | 13.9% |
| Mean | 18.8% | 10.0% |
| Median | 15.7% | 10.0% |
| Interquartile 25% (IQ1) | 13.3% | 8.8% |
| Interquartile 75% (IQ3) | 20.1% | 11.2% |
| Interquartile Range (IQR) | 6.8% | 2.4% |
| Standard Deviation (Sample) | 12.0% | 2.5% |
| Standard Deviation (Population) | 11.9% | 2.5% |
Similar Demographics by Disability
Demographics Similar to Spanish Americans by Disability
In terms of disability, the demographic groups most similar to Spanish Americans are Delaware (13.6%, a difference of 0.24%), Blackfeet (13.6%, a difference of 0.28%), Cree (13.7%, a difference of 0.35%), Black/African American (13.7%, a difference of 0.39%), and Puget Sound Salish (13.7%, a difference of 0.39%).
| Demographics | Rating | Rank | Disability |
| French Canadians | 0.0 /100 | #305 | Tragic 13.4% |
| Cape Verdeans | 0.0 /100 | #306 | Tragic 13.5% |
| Shoshone | 0.0 /100 | #307 | Tragic 13.5% |
| French American Indians | 0.0 /100 | #308 | Tragic 13.5% |
| Tlingit-Haida | 0.0 /100 | #309 | Tragic 13.5% |
| Blackfeet | 0.0 /100 | #310 | Tragic 13.6% |
| Delaware | 0.0 /100 | #311 | Tragic 13.6% |
| Spanish Americans | 0.0 /100 | #312 | Tragic 13.6% |
| Cree | 0.0 /100 | #313 | Tragic 13.7% |
| Blacks/African Americans | 0.0 /100 | #314 | Tragic 13.7% |
| Puget Sound Salish | 0.0 /100 | #315 | Tragic 13.7% |
| Pima | 0.0 /100 | #316 | Tragic 13.7% |
| Immigrants | Cabo Verde | 0.0 /100 | #317 | Tragic 13.7% |
| Menominee | 0.0 /100 | #318 | Tragic 13.8% |
| Iroquois | 0.0 /100 | #319 | Tragic 13.8% |
Demographics Similar to Ethiopians by Disability
In terms of disability, the demographic groups most similar to Ethiopians are Turkish (10.7%, a difference of 0.010%), Immigrants from Indonesia (10.7%, a difference of 0.060%), Immigrants from Ethiopia (10.7%, a difference of 0.070%), Immigrants from Kuwait (10.7%, a difference of 0.29%), and Afghan (10.8%, a difference of 0.45%).
| Demographics | Rating | Rank | Disability |
| Immigrants | Argentina | 100.0 /100 | #29 | Exceptional 10.6% |
| Immigrants | Turkey | 100.0 /100 | #30 | Exceptional 10.6% |
| Immigrants | Egypt | 100.0 /100 | #31 | Exceptional 10.6% |
| Paraguayans | 100.0 /100 | #32 | Exceptional 10.6% |
| Immigrants | Kuwait | 100.0 /100 | #33 | Exceptional 10.7% |
| Immigrants | Ethiopia | 100.0 /100 | #34 | Exceptional 10.7% |
| Immigrants | Indonesia | 100.0 /100 | #35 | Exceptional 10.7% |
| Ethiopians | 100.0 /100 | #36 | Exceptional 10.7% |
| Turks | 100.0 /100 | #37 | Exceptional 10.7% |
| Afghans | 99.9 /100 | #38 | Exceptional 10.8% |
| Cambodians | 99.9 /100 | #39 | Exceptional 10.8% |
| Mongolians | 99.9 /100 | #40 | Exceptional 10.8% |
| Immigrants | Australia | 99.9 /100 | #41 | Exceptional 10.8% |
| Immigrants | Nepal | 99.9 /100 | #42 | Exceptional 10.8% |
| Israelis | 99.9 /100 | #43 | Exceptional 10.8% |