Soviet Union vs Immigrants from Nicaragua Self-Care Disability
COMPARE
Soviet Union
Immigrants from Nicaragua
Self-Care Disability
Self-Care Disability Comparison
Soviet Union
Immigrants from Nicaragua
2.5%
SELF-CARE DISABILITY
22.2/ 100
METRIC RATING
192nd/ 347
METRIC RANK
2.7%
SELF-CARE DISABILITY
0.2/ 100
METRIC RATING
265th/ 347
METRIC RANK
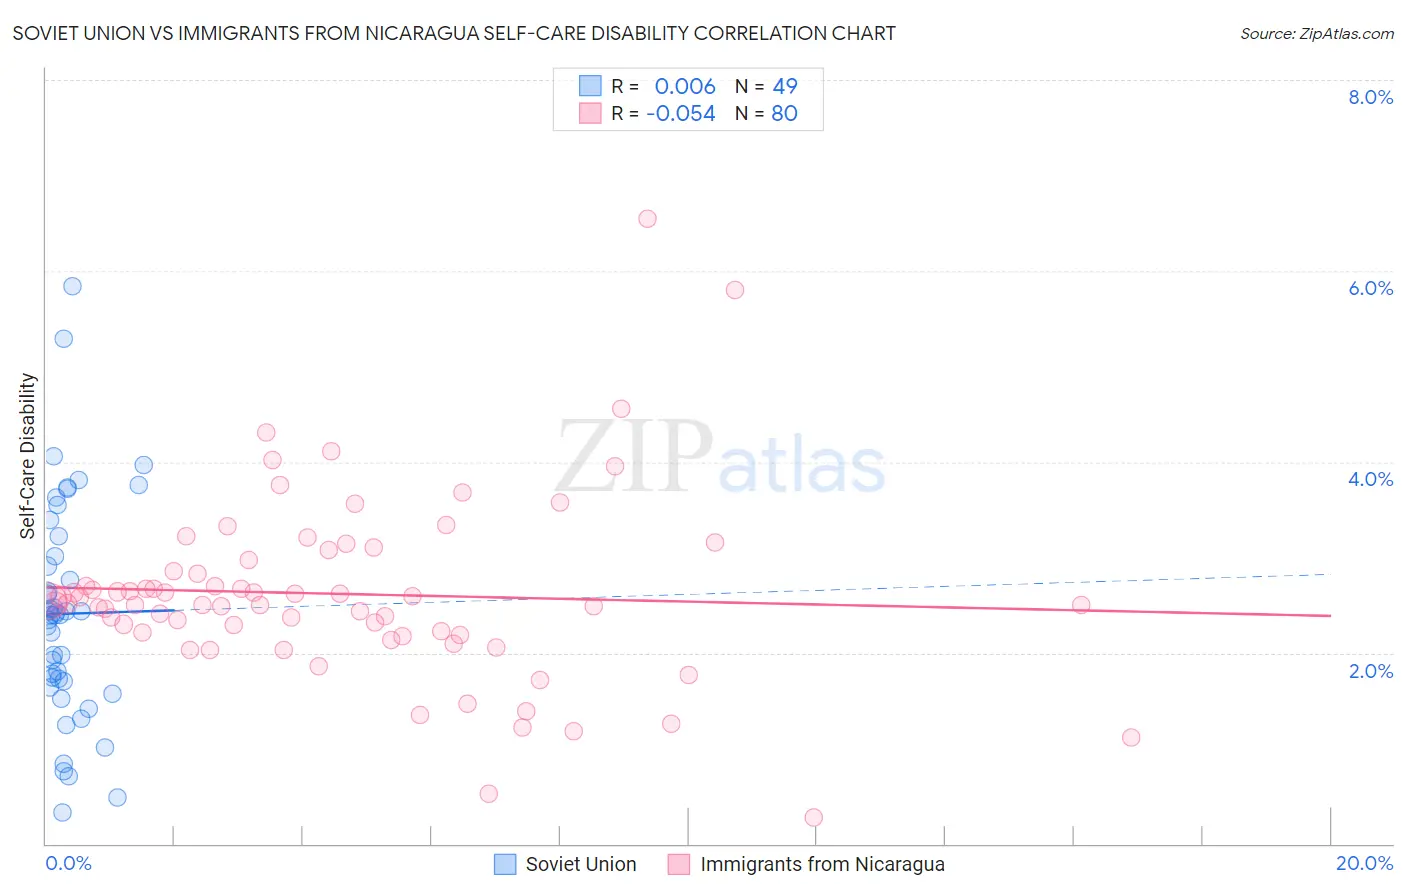
Soviet Union vs Immigrants from Nicaragua Self-Care Disability Correlation Chart
The statistical analysis conducted on geographies consisting of 43,492,822 people shows no correlation between the proportion of Soviet Union and percentage of population with self-care disability in the United States with a correlation coefficient (R) of 0.006 and weighted average of 2.5%. Similarly, the statistical analysis conducted on geographies consisting of 236,309,405 people shows a slight negative correlation between the proportion of Immigrants from Nicaragua and percentage of population with self-care disability in the United States with a correlation coefficient (R) of -0.054 and weighted average of 2.7%, a difference of 6.1%.
Self-Care Disability Correlation Summary
| Measurement | Soviet Union | Immigrants from Nicaragua |
| Minimum | 0.32% | 0.27% |
| Maximum | 5.8% | 6.5% |
| Range | 5.5% | 6.3% |
| Mean | 2.4% | 2.6% |
| Median | 2.4% | 2.5% |
| Interquartile 25% (IQ1) | 1.7% | 2.2% |
| Interquartile 75% (IQ3) | 3.1% | 2.9% |
| Interquartile Range (IQR) | 1.5% | 0.71% |
| Standard Deviation (Sample) | 1.2% | 0.96% |
| Standard Deviation (Population) | 1.1% | 0.96% |
Similar Demographics by Self-Care Disability
Demographics Similar to Soviet Union by Self-Care Disability
In terms of self-care disability, the demographic groups most similar to Soviet Union are Moroccan (2.5%, a difference of 0.050%), Ukrainian (2.5%, a difference of 0.060%), Sioux (2.5%, a difference of 0.16%), Immigrants from Germany (2.5%, a difference of 0.32%), and Immigrants from Eastern Europe (2.5%, a difference of 0.36%).
| Demographics | Rating | Rank | Self-Care Disability |
| Slavs | 34.3 /100 | #185 | Fair 2.5% |
| Immigrants | El Salvador | 33.0 /100 | #186 | Fair 2.5% |
| Irish | 28.7 /100 | #187 | Fair 2.5% |
| Immigrants | Oceania | 28.3 /100 | #188 | Fair 2.5% |
| Immigrants | Eastern Europe | 28.0 /100 | #189 | Fair 2.5% |
| Sioux | 24.6 /100 | #190 | Fair 2.5% |
| Moroccans | 22.9 /100 | #191 | Fair 2.5% |
| Soviet Union | 22.2 /100 | #192 | Fair 2.5% |
| Ukrainians | 21.4 /100 | #193 | Fair 2.5% |
| Immigrants | Germany | 17.9 /100 | #194 | Poor 2.5% |
| Immigrants | Southern Europe | 15.6 /100 | #195 | Poor 2.5% |
| Koreans | 15.5 /100 | #196 | Poor 2.5% |
| Crow | 15.2 /100 | #197 | Poor 2.5% |
| Immigrants | Immigrants | 15.0 /100 | #198 | Poor 2.5% |
| Immigrants | Ghana | 14.7 /100 | #199 | Poor 2.5% |
Demographics Similar to Immigrants from Nicaragua by Self-Care Disability
In terms of self-care disability, the demographic groups most similar to Immigrants from Nicaragua are Immigrants from Cambodia (2.7%, a difference of 0.050%), Immigrants from Iran (2.7%, a difference of 0.16%), Immigrants from Latin America (2.7%, a difference of 0.22%), Yaqui (2.7%, a difference of 0.25%), and Shoshone (2.7%, a difference of 0.29%).
| Demographics | Rating | Rank | Self-Care Disability |
| Immigrants | Nonimmigrants | 0.3 /100 | #258 | Tragic 2.6% |
| Immigrants | Belarus | 0.2 /100 | #259 | Tragic 2.6% |
| Chippewa | 0.2 /100 | #260 | Tragic 2.6% |
| Arapaho | 0.2 /100 | #261 | Tragic 2.6% |
| Shoshone | 0.2 /100 | #262 | Tragic 2.7% |
| Immigrants | Latin America | 0.2 /100 | #263 | Tragic 2.7% |
| Immigrants | Iran | 0.2 /100 | #264 | Tragic 2.7% |
| Immigrants | Nicaragua | 0.2 /100 | #265 | Tragic 2.7% |
| Immigrants | Cambodia | 0.1 /100 | #266 | Tragic 2.7% |
| Yaqui | 0.1 /100 | #267 | Tragic 2.7% |
| Immigrants | Mexico | 0.1 /100 | #268 | Tragic 2.7% |
| U.S. Virgin Islanders | 0.1 /100 | #269 | Tragic 2.7% |
| Immigrants | Micronesia | 0.1 /100 | #270 | Tragic 2.7% |
| Trinidadians and Tobagonians | 0.1 /100 | #271 | Tragic 2.7% |
| Immigrants | Laos | 0.1 /100 | #272 | Tragic 2.7% |