Soviet Union vs Iraqi Self-Care Disability
COMPARE
Soviet Union
Iraqi
Self-Care Disability
Self-Care Disability Comparison
Soviet Union
Iraqis
2.5%
SELF-CARE DISABILITY
22.2/ 100
METRIC RATING
192nd/ 347
METRIC RANK
2.6%
SELF-CARE DISABILITY
3.2/ 100
METRIC RATING
225th/ 347
METRIC RANK
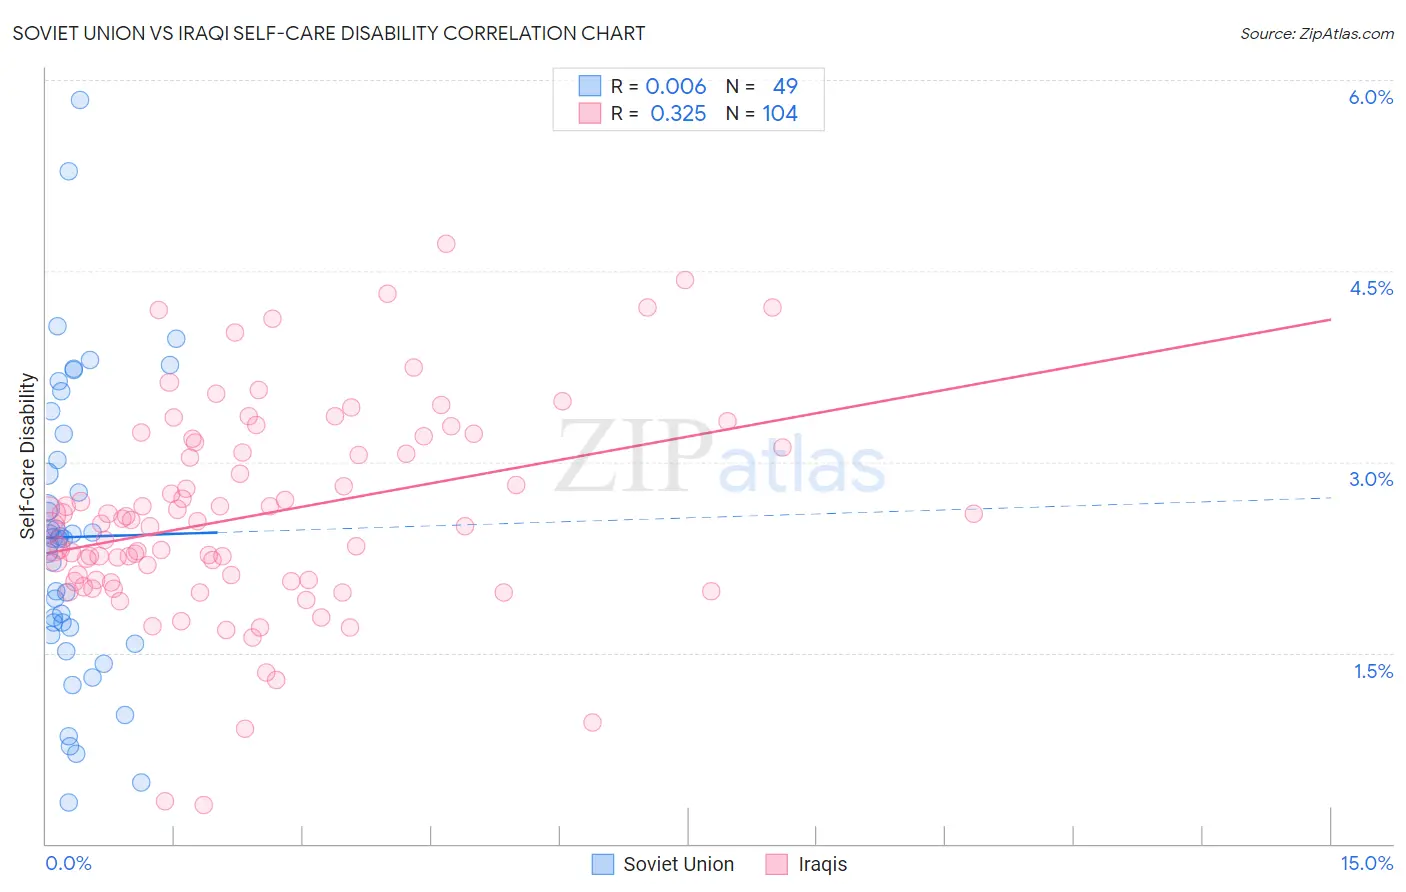
Soviet Union vs Iraqi Self-Care Disability Correlation Chart
The statistical analysis conducted on geographies consisting of 43,492,822 people shows no correlation between the proportion of Soviet Union and percentage of population with self-care disability in the United States with a correlation coefficient (R) of 0.006 and weighted average of 2.5%. Similarly, the statistical analysis conducted on geographies consisting of 170,619,195 people shows a mild positive correlation between the proportion of Iraqis and percentage of population with self-care disability in the United States with a correlation coefficient (R) of 0.325 and weighted average of 2.6%, a difference of 2.5%.
Self-Care Disability Correlation Summary
| Measurement | Soviet Union | Iraqi |
| Minimum | 0.32% | 0.30% |
| Maximum | 5.8% | 4.7% |
| Range | 5.5% | 4.4% |
| Mean | 2.4% | 2.6% |
| Median | 2.4% | 2.5% |
| Interquartile 25% (IQ1) | 1.7% | 2.1% |
| Interquartile 75% (IQ3) | 3.1% | 3.1% |
| Interquartile Range (IQR) | 1.5% | 1.1% |
| Standard Deviation (Sample) | 1.2% | 0.81% |
| Standard Deviation (Population) | 1.1% | 0.81% |
Similar Demographics by Self-Care Disability
Demographics Similar to Soviet Union by Self-Care Disability
In terms of self-care disability, the demographic groups most similar to Soviet Union are Moroccan (2.5%, a difference of 0.050%), Ukrainian (2.5%, a difference of 0.060%), Sioux (2.5%, a difference of 0.16%), Immigrants from Germany (2.5%, a difference of 0.32%), and Immigrants from Eastern Europe (2.5%, a difference of 0.36%).
| Demographics | Rating | Rank | Self-Care Disability |
| Slavs | 34.3 /100 | #185 | Fair 2.5% |
| Immigrants | El Salvador | 33.0 /100 | #186 | Fair 2.5% |
| Irish | 28.7 /100 | #187 | Fair 2.5% |
| Immigrants | Oceania | 28.3 /100 | #188 | Fair 2.5% |
| Immigrants | Eastern Europe | 28.0 /100 | #189 | Fair 2.5% |
| Sioux | 24.6 /100 | #190 | Fair 2.5% |
| Moroccans | 22.9 /100 | #191 | Fair 2.5% |
| Soviet Union | 22.2 /100 | #192 | Fair 2.5% |
| Ukrainians | 21.4 /100 | #193 | Fair 2.5% |
| Immigrants | Germany | 17.9 /100 | #194 | Poor 2.5% |
| Immigrants | Southern Europe | 15.6 /100 | #195 | Poor 2.5% |
| Koreans | 15.5 /100 | #196 | Poor 2.5% |
| Crow | 15.2 /100 | #197 | Poor 2.5% |
| Immigrants | Immigrants | 15.0 /100 | #198 | Poor 2.5% |
| Immigrants | Ghana | 14.7 /100 | #199 | Poor 2.5% |
Demographics Similar to Iraqis by Self-Care Disability
In terms of self-care disability, the demographic groups most similar to Iraqis are Chinese (2.6%, a difference of 0.10%), Osage (2.6%, a difference of 0.16%), Immigrants from Philippines (2.6%, a difference of 0.18%), Guatemalan (2.6%, a difference of 0.19%), and Spaniard (2.6%, a difference of 0.22%).
| Demographics | Rating | Rank | Self-Care Disability |
| Scotch-Irish | 4.1 /100 | #218 | Tragic 2.6% |
| Immigrants | Moldova | 4.0 /100 | #219 | Tragic 2.6% |
| Sub-Saharan Africans | 4.0 /100 | #220 | Tragic 2.6% |
| Hondurans | 3.8 /100 | #221 | Tragic 2.6% |
| Spaniards | 3.8 /100 | #222 | Tragic 2.6% |
| French Canadians | 3.8 /100 | #223 | Tragic 2.6% |
| Osage | 3.6 /100 | #224 | Tragic 2.6% |
| Iraqis | 3.2 /100 | #225 | Tragic 2.6% |
| Chinese | 2.9 /100 | #226 | Tragic 2.6% |
| Immigrants | Philippines | 2.7 /100 | #227 | Tragic 2.6% |
| Guatemalans | 2.7 /100 | #228 | Tragic 2.6% |
| Guamanians/Chamorros | 2.5 /100 | #229 | Tragic 2.6% |
| Immigrants | Ecuador | 2.5 /100 | #230 | Tragic 2.6% |
| Immigrants | Guatemala | 2.2 /100 | #231 | Tragic 2.6% |
| Albanians | 2.2 /100 | #232 | Tragic 2.6% |