Soviet Union vs New Zealander Self-Care Disability
COMPARE
Soviet Union
New Zealander
Self-Care Disability
Self-Care Disability Comparison
Soviet Union
New Zealanders
2.5%
SELF-CARE DISABILITY
22.2/ 100
METRIC RATING
192nd/ 347
METRIC RANK
2.3%
SELF-CARE DISABILITY
99.5/ 100
METRIC RATING
59th/ 347
METRIC RANK
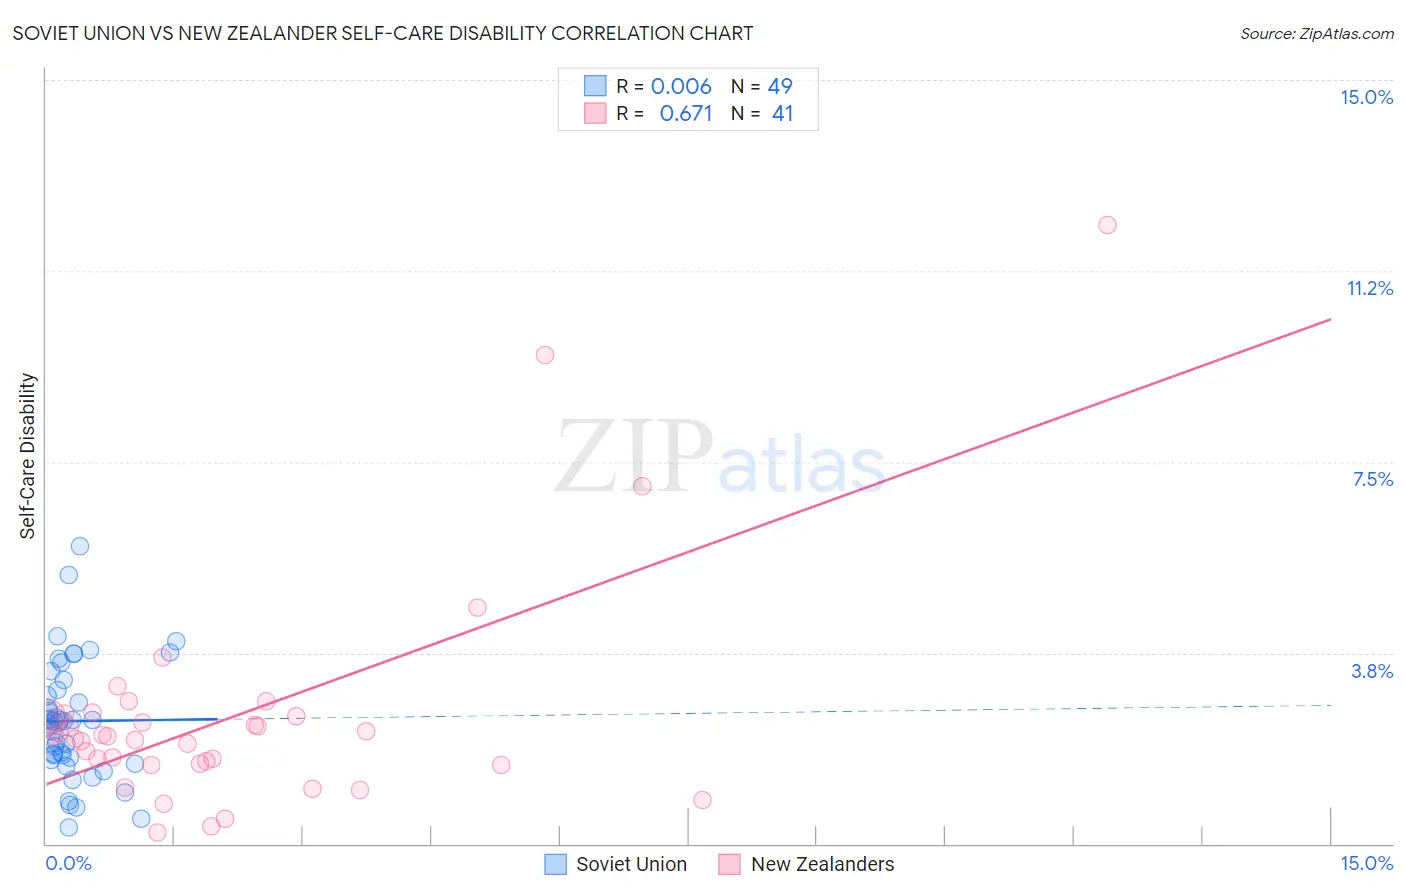
Soviet Union vs New Zealander Self-Care Disability Correlation Chart
The statistical analysis conducted on geographies consisting of 43,492,822 people shows no correlation between the proportion of Soviet Union and percentage of population with self-care disability in the United States with a correlation coefficient (R) of 0.006 and weighted average of 2.5%. Similarly, the statistical analysis conducted on geographies consisting of 106,879,653 people shows a significant positive correlation between the proportion of New Zealanders and percentage of population with self-care disability in the United States with a correlation coefficient (R) of 0.671 and weighted average of 2.3%, a difference of 8.4%.
Self-Care Disability Correlation Summary
| Measurement | Soviet Union | New Zealander |
| Minimum | 0.32% | 0.21% |
| Maximum | 5.8% | 12.2% |
| Range | 5.5% | 11.9% |
| Mean | 2.4% | 2.5% |
| Median | 2.4% | 2.1% |
| Interquartile 25% (IQ1) | 1.7% | 1.6% |
| Interquartile 75% (IQ3) | 3.1% | 2.5% |
| Interquartile Range (IQR) | 1.5% | 0.97% |
| Standard Deviation (Sample) | 1.2% | 2.3% |
| Standard Deviation (Population) | 1.1% | 2.2% |
Similar Demographics by Self-Care Disability
Demographics Similar to Soviet Union by Self-Care Disability
In terms of self-care disability, the demographic groups most similar to Soviet Union are Moroccan (2.5%, a difference of 0.050%), Ukrainian (2.5%, a difference of 0.060%), Sioux (2.5%, a difference of 0.16%), Immigrants from Germany (2.5%, a difference of 0.32%), and Immigrants from Eastern Europe (2.5%, a difference of 0.36%).
| Demographics | Rating | Rank | Self-Care Disability |
| Slavs | 34.3 /100 | #185 | Fair 2.5% |
| Immigrants | El Salvador | 33.0 /100 | #186 | Fair 2.5% |
| Irish | 28.7 /100 | #187 | Fair 2.5% |
| Immigrants | Oceania | 28.3 /100 | #188 | Fair 2.5% |
| Immigrants | Eastern Europe | 28.0 /100 | #189 | Fair 2.5% |
| Sioux | 24.6 /100 | #190 | Fair 2.5% |
| Moroccans | 22.9 /100 | #191 | Fair 2.5% |
| Soviet Union | 22.2 /100 | #192 | Fair 2.5% |
| Ukrainians | 21.4 /100 | #193 | Fair 2.5% |
| Immigrants | Germany | 17.9 /100 | #194 | Poor 2.5% |
| Immigrants | Southern Europe | 15.6 /100 | #195 | Poor 2.5% |
| Koreans | 15.5 /100 | #196 | Poor 2.5% |
| Crow | 15.2 /100 | #197 | Poor 2.5% |
| Immigrants | Immigrants | 15.0 /100 | #198 | Poor 2.5% |
| Immigrants | Ghana | 14.7 /100 | #199 | Poor 2.5% |
Demographics Similar to New Zealanders by Self-Care Disability
In terms of self-care disability, the demographic groups most similar to New Zealanders are Immigrants from Cameroon (2.3%, a difference of 0.11%), Immigrants from Japan (2.3%, a difference of 0.14%), Immigrants from Belgium (2.3%, a difference of 0.18%), Immigrants from Eastern Asia (2.3%, a difference of 0.19%), and Immigrants from France (2.3%, a difference of 0.23%).
| Demographics | Rating | Rank | Self-Care Disability |
| Immigrants | Serbia | 99.6 /100 | #52 | Exceptional 2.3% |
| Australians | 99.6 /100 | #53 | Exceptional 2.3% |
| Argentineans | 99.6 /100 | #54 | Exceptional 2.3% |
| Immigrants | France | 99.6 /100 | #55 | Exceptional 2.3% |
| Immigrants | Eastern Asia | 99.6 /100 | #56 | Exceptional 2.3% |
| Immigrants | Belgium | 99.6 /100 | #57 | Exceptional 2.3% |
| Immigrants | Cameroon | 99.6 /100 | #58 | Exceptional 2.3% |
| New Zealanders | 99.5 /100 | #59 | Exceptional 2.3% |
| Immigrants | Japan | 99.5 /100 | #60 | Exceptional 2.3% |
| Palestinians | 99.4 /100 | #61 | Exceptional 2.3% |
| Egyptians | 99.4 /100 | #62 | Exceptional 2.3% |
| Mongolians | 99.3 /100 | #63 | Exceptional 2.3% |
| Swedes | 99.3 /100 | #64 | Exceptional 2.3% |
| Brazilians | 99.3 /100 | #65 | Exceptional 2.3% |
| Immigrants | Argentina | 99.3 /100 | #66 | Exceptional 2.3% |