Liberian vs Immigrants from Nicaragua Self-Care Disability
COMPARE
Liberian
Immigrants from Nicaragua
Self-Care Disability
Self-Care Disability Comparison
Liberians
Immigrants from Nicaragua
2.6%
SELF-CARE DISABILITY
2.1/ 100
METRIC RATING
233rd/ 347
METRIC RANK
2.7%
SELF-CARE DISABILITY
0.2/ 100
METRIC RATING
265th/ 347
METRIC RANK
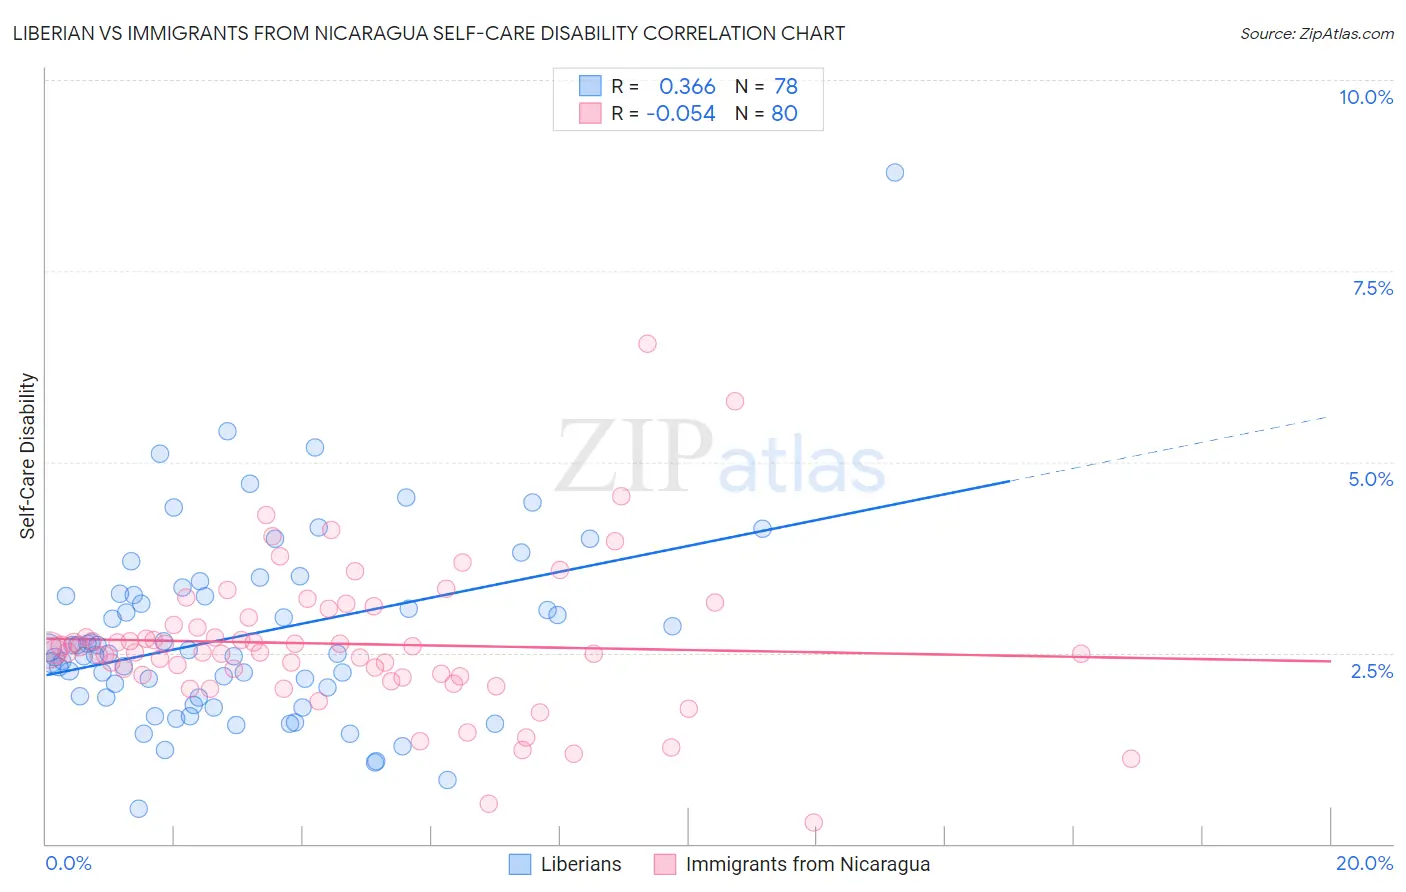
Liberian vs Immigrants from Nicaragua Self-Care Disability Correlation Chart
The statistical analysis conducted on geographies consisting of 117,995,885 people shows a mild positive correlation between the proportion of Liberians and percentage of population with self-care disability in the United States with a correlation coefficient (R) of 0.366 and weighted average of 2.6%. Similarly, the statistical analysis conducted on geographies consisting of 236,309,405 people shows a slight negative correlation between the proportion of Immigrants from Nicaragua and percentage of population with self-care disability in the United States with a correlation coefficient (R) of -0.054 and weighted average of 2.7%, a difference of 3.0%.
Self-Care Disability Correlation Summary
| Measurement | Liberian | Immigrants from Nicaragua |
| Minimum | 0.46% | 0.27% |
| Maximum | 8.8% | 6.5% |
| Range | 8.3% | 6.3% |
| Mean | 2.7% | 2.6% |
| Median | 2.5% | 2.5% |
| Interquartile 25% (IQ1) | 1.9% | 2.2% |
| Interquartile 75% (IQ3) | 3.2% | 2.9% |
| Interquartile Range (IQR) | 1.3% | 0.71% |
| Standard Deviation (Sample) | 1.3% | 0.96% |
| Standard Deviation (Population) | 1.2% | 0.96% |
Similar Demographics by Self-Care Disability
Demographics Similar to Liberians by Self-Care Disability
In terms of self-care disability, the demographic groups most similar to Liberians are Vietnamese (2.6%, a difference of 0.010%), Albanian (2.6%, a difference of 0.040%), Bahamian (2.6%, a difference of 0.040%), Immigrants from Guatemala (2.6%, a difference of 0.070%), and Bermudan (2.6%, a difference of 0.11%).
| Demographics | Rating | Rank | Self-Care Disability |
| Chinese | 2.9 /100 | #226 | Tragic 2.6% |
| Immigrants | Philippines | 2.7 /100 | #227 | Tragic 2.6% |
| Guatemalans | 2.7 /100 | #228 | Tragic 2.6% |
| Guamanians/Chamorros | 2.5 /100 | #229 | Tragic 2.6% |
| Immigrants | Ecuador | 2.5 /100 | #230 | Tragic 2.6% |
| Immigrants | Guatemala | 2.2 /100 | #231 | Tragic 2.6% |
| Albanians | 2.2 /100 | #232 | Tragic 2.6% |
| Liberians | 2.1 /100 | #233 | Tragic 2.6% |
| Vietnamese | 2.1 /100 | #234 | Tragic 2.6% |
| Bahamians | 2.0 /100 | #235 | Tragic 2.6% |
| Bermudans | 1.9 /100 | #236 | Tragic 2.6% |
| Immigrants | Senegal | 1.6 /100 | #237 | Tragic 2.6% |
| Senegalese | 1.3 /100 | #238 | Tragic 2.6% |
| Immigrants | Panama | 1.2 /100 | #239 | Tragic 2.6% |
| Marshallese | 1.2 /100 | #240 | Tragic 2.6% |
Demographics Similar to Immigrants from Nicaragua by Self-Care Disability
In terms of self-care disability, the demographic groups most similar to Immigrants from Nicaragua are Immigrants from Cambodia (2.7%, a difference of 0.050%), Immigrants from Iran (2.7%, a difference of 0.16%), Immigrants from Latin America (2.7%, a difference of 0.22%), Yaqui (2.7%, a difference of 0.25%), and Shoshone (2.7%, a difference of 0.29%).
| Demographics | Rating | Rank | Self-Care Disability |
| Immigrants | Nonimmigrants | 0.3 /100 | #258 | Tragic 2.6% |
| Immigrants | Belarus | 0.2 /100 | #259 | Tragic 2.6% |
| Chippewa | 0.2 /100 | #260 | Tragic 2.6% |
| Arapaho | 0.2 /100 | #261 | Tragic 2.6% |
| Shoshone | 0.2 /100 | #262 | Tragic 2.7% |
| Immigrants | Latin America | 0.2 /100 | #263 | Tragic 2.7% |
| Immigrants | Iran | 0.2 /100 | #264 | Tragic 2.7% |
| Immigrants | Nicaragua | 0.2 /100 | #265 | Tragic 2.7% |
| Immigrants | Cambodia | 0.1 /100 | #266 | Tragic 2.7% |
| Yaqui | 0.1 /100 | #267 | Tragic 2.7% |
| Immigrants | Mexico | 0.1 /100 | #268 | Tragic 2.7% |
| U.S. Virgin Islanders | 0.1 /100 | #269 | Tragic 2.7% |
| Immigrants | Micronesia | 0.1 /100 | #270 | Tragic 2.7% |
| Trinidadians and Tobagonians | 0.1 /100 | #271 | Tragic 2.7% |
| Immigrants | Laos | 0.1 /100 | #272 | Tragic 2.7% |