Soviet Union vs Immigrants from Afghanistan Self-Care Disability
COMPARE
Soviet Union
Immigrants from Afghanistan
Self-Care Disability
Self-Care Disability Comparison
Soviet Union
Immigrants from Afghanistan
2.5%
SELF-CARE DISABILITY
22.2/ 100
METRIC RATING
192nd/ 347
METRIC RANK
2.5%
SELF-CARE DISABILITY
47.6/ 100
METRIC RATING
176th/ 347
METRIC RANK
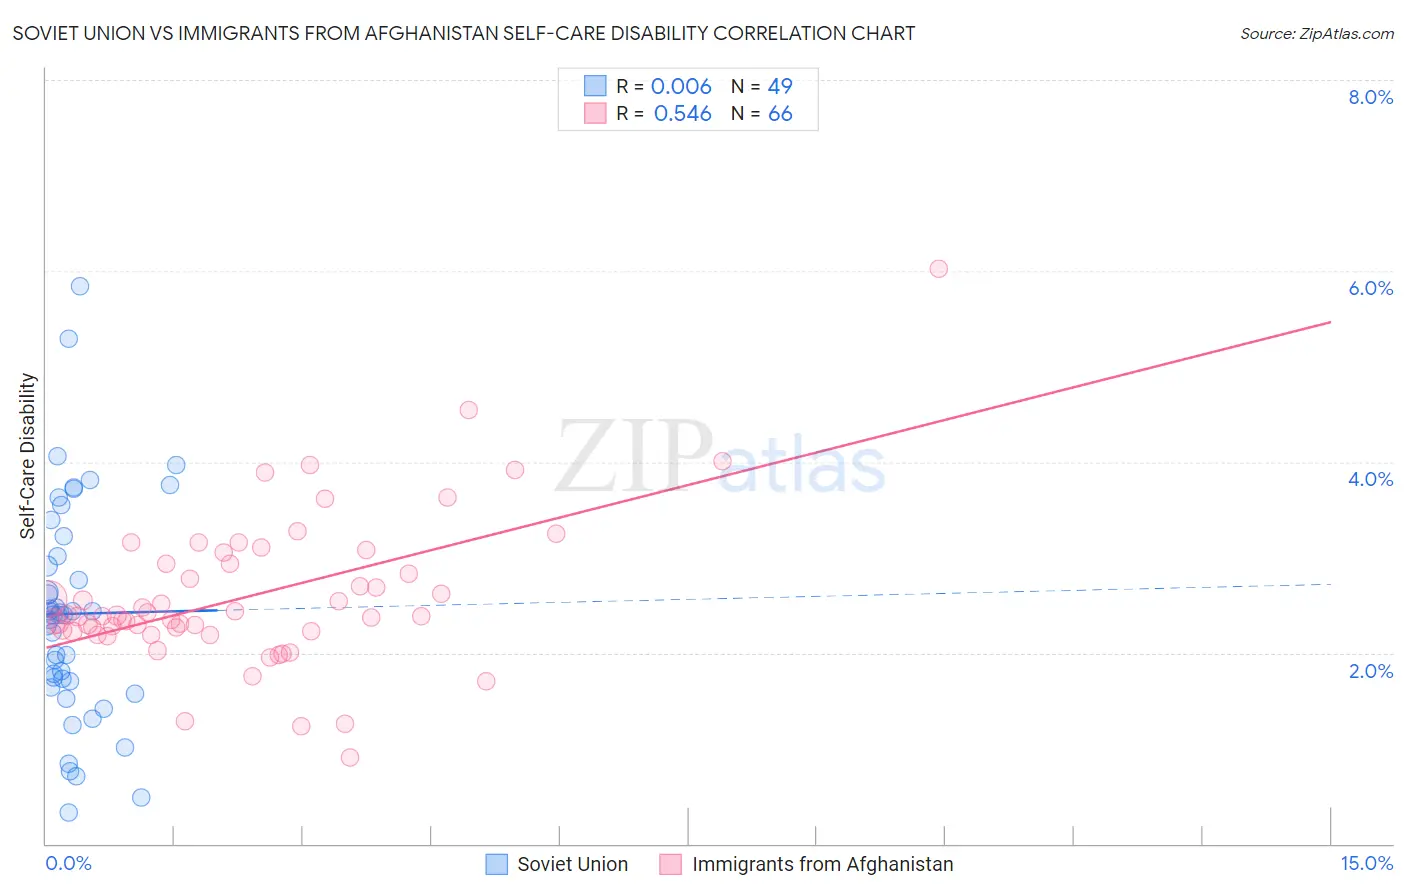
Soviet Union vs Immigrants from Afghanistan Self-Care Disability Correlation Chart
The statistical analysis conducted on geographies consisting of 43,492,822 people shows no correlation between the proportion of Soviet Union and percentage of population with self-care disability in the United States with a correlation coefficient (R) of 0.006 and weighted average of 2.5%. Similarly, the statistical analysis conducted on geographies consisting of 147,580,725 people shows a substantial positive correlation between the proportion of Immigrants from Afghanistan and percentage of population with self-care disability in the United States with a correlation coefficient (R) of 0.546 and weighted average of 2.5%, a difference of 1.4%.
Self-Care Disability Correlation Summary
| Measurement | Soviet Union | Immigrants from Afghanistan |
| Minimum | 0.32% | 0.91% |
| Maximum | 5.8% | 6.0% |
| Range | 5.5% | 5.1% |
| Mean | 2.4% | 2.6% |
| Median | 2.4% | 2.4% |
| Interquartile 25% (IQ1) | 1.7% | 2.2% |
| Interquartile 75% (IQ3) | 3.1% | 2.9% |
| Interquartile Range (IQR) | 1.5% | 0.71% |
| Standard Deviation (Sample) | 1.2% | 0.80% |
| Standard Deviation (Population) | 1.1% | 0.80% |
Demographics Similar to Soviet Union and Immigrants from Afghanistan by Self-Care Disability
In terms of self-care disability, the demographic groups most similar to Soviet Union are Moroccan (2.5%, a difference of 0.050%), Ukrainian (2.5%, a difference of 0.060%), Sioux (2.5%, a difference of 0.16%), Immigrants from Germany (2.5%, a difference of 0.32%), and Immigrants from Eastern Europe (2.5%, a difference of 0.36%). Similarly, the demographic groups most similar to Immigrants from Afghanistan are Immigrants from Kazakhstan (2.5%, a difference of 0.040%), English (2.5%, a difference of 0.070%), Immigrants from Bosnia and Herzegovina (2.5%, a difference of 0.090%), Hungarian (2.5%, a difference of 0.10%), and Welsh (2.5%, a difference of 0.11%).
| Demographics | Rating | Rank | Self-Care Disability |
| Welsh | 50.0 /100 | #174 | Average 2.5% |
| Immigrants | Bosnia and Herzegovina | 49.6 /100 | #175 | Average 2.5% |
| Immigrants | Afghanistan | 47.6 /100 | #176 | Average 2.5% |
| Immigrants | Kazakhstan | 46.7 /100 | #177 | Average 2.5% |
| English | 46.2 /100 | #178 | Average 2.5% |
| Hungarians | 45.5 /100 | #179 | Average 2.5% |
| Indonesians | 41.2 /100 | #180 | Average 2.5% |
| Ghanaians | 40.4 /100 | #181 | Average 2.5% |
| Maltese | 37.5 /100 | #182 | Fair 2.5% |
| Salvadorans | 36.4 /100 | #183 | Fair 2.5% |
| Yugoslavians | 36.1 /100 | #184 | Fair 2.5% |
| Slavs | 34.3 /100 | #185 | Fair 2.5% |
| Immigrants | El Salvador | 33.0 /100 | #186 | Fair 2.5% |
| Irish | 28.7 /100 | #187 | Fair 2.5% |
| Immigrants | Oceania | 28.3 /100 | #188 | Fair 2.5% |
| Immigrants | Eastern Europe | 28.0 /100 | #189 | Fair 2.5% |
| Sioux | 24.6 /100 | #190 | Fair 2.5% |
| Moroccans | 22.9 /100 | #191 | Fair 2.5% |
| Soviet Union | 22.2 /100 | #192 | Fair 2.5% |
| Ukrainians | 21.4 /100 | #193 | Fair 2.5% |
| Immigrants | Germany | 17.9 /100 | #194 | Poor 2.5% |