Soviet Union vs Black/African American Self-Care Disability
COMPARE
Soviet Union
Black/African American
Self-Care Disability
Self-Care Disability Comparison
Soviet Union
Blacks/African Americans
2.5%
SELF-CARE DISABILITY
22.2/ 100
METRIC RATING
192nd/ 347
METRIC RANK
2.9%
SELF-CARE DISABILITY
0.0/ 100
METRIC RATING
327th/ 347
METRIC RANK
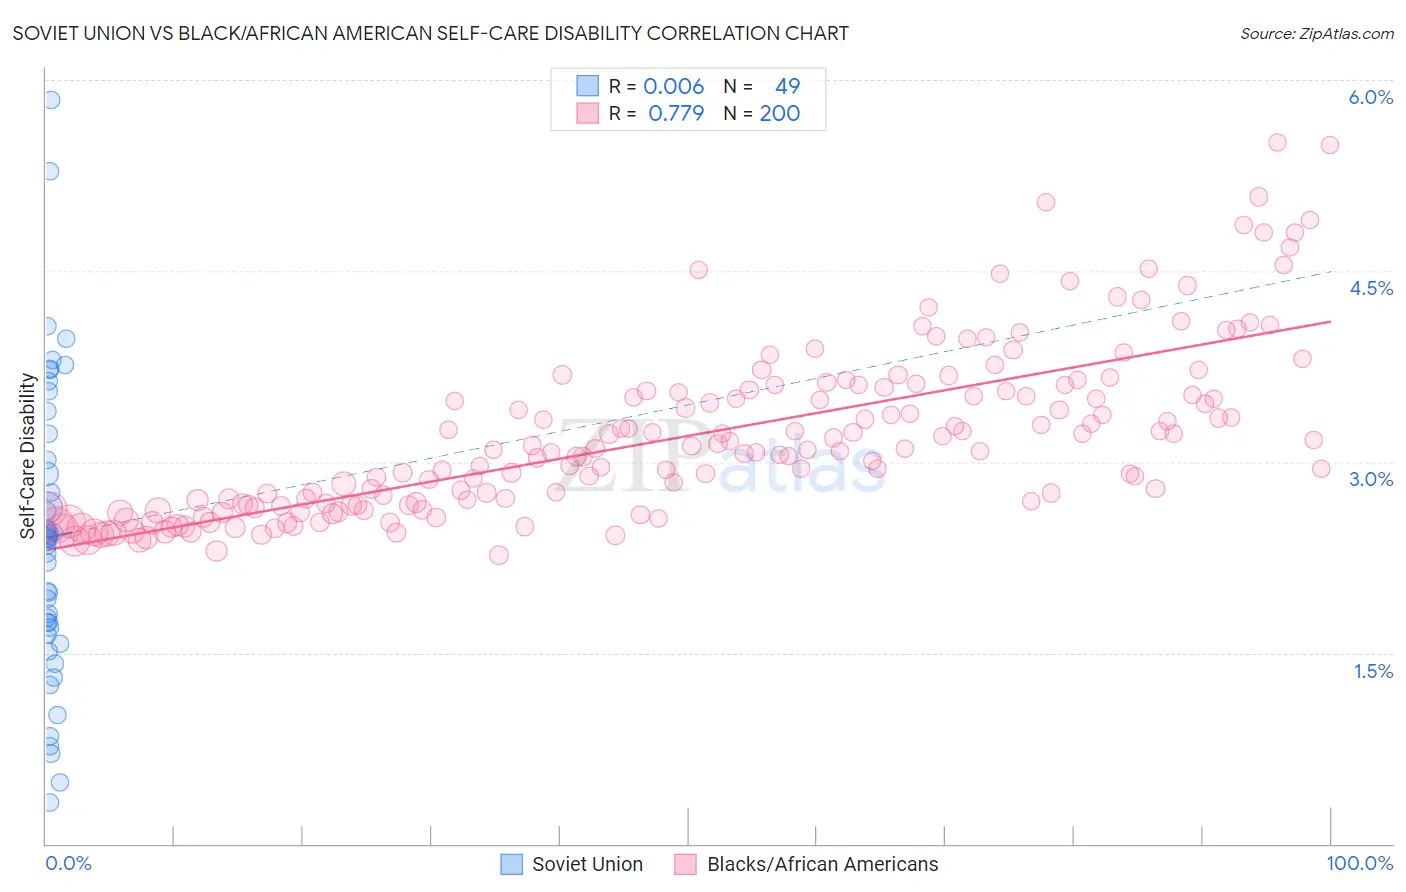
Soviet Union vs Black/African American Self-Care Disability Correlation Chart
The statistical analysis conducted on geographies consisting of 43,492,822 people shows no correlation between the proportion of Soviet Union and percentage of population with self-care disability in the United States with a correlation coefficient (R) of 0.006 and weighted average of 2.5%. Similarly, the statistical analysis conducted on geographies consisting of 564,146,018 people shows a strong positive correlation between the proportion of Blacks/African Americans and percentage of population with self-care disability in the United States with a correlation coefficient (R) of 0.779 and weighted average of 2.9%, a difference of 16.8%.
Self-Care Disability Correlation Summary
| Measurement | Soviet Union | Black/African American |
| Minimum | 0.32% | 2.3% |
| Maximum | 5.8% | 5.5% |
| Range | 5.5% | 3.2% |
| Mean | 2.4% | 3.2% |
| Median | 2.4% | 3.1% |
| Interquartile 25% (IQ1) | 1.7% | 2.7% |
| Interquartile 75% (IQ3) | 3.1% | 3.6% |
| Interquartile Range (IQR) | 1.5% | 0.89% |
| Standard Deviation (Sample) | 1.2% | 0.67% |
| Standard Deviation (Population) | 1.1% | 0.67% |
Similar Demographics by Self-Care Disability
Demographics Similar to Soviet Union by Self-Care Disability
In terms of self-care disability, the demographic groups most similar to Soviet Union are Moroccan (2.5%, a difference of 0.050%), Ukrainian (2.5%, a difference of 0.060%), Sioux (2.5%, a difference of 0.16%), Immigrants from Germany (2.5%, a difference of 0.32%), and Immigrants from Eastern Europe (2.5%, a difference of 0.36%).
| Demographics | Rating | Rank | Self-Care Disability |
| Slavs | 34.3 /100 | #185 | Fair 2.5% |
| Immigrants | El Salvador | 33.0 /100 | #186 | Fair 2.5% |
| Irish | 28.7 /100 | #187 | Fair 2.5% |
| Immigrants | Oceania | 28.3 /100 | #188 | Fair 2.5% |
| Immigrants | Eastern Europe | 28.0 /100 | #189 | Fair 2.5% |
| Sioux | 24.6 /100 | #190 | Fair 2.5% |
| Moroccans | 22.9 /100 | #191 | Fair 2.5% |
| Soviet Union | 22.2 /100 | #192 | Fair 2.5% |
| Ukrainians | 21.4 /100 | #193 | Fair 2.5% |
| Immigrants | Germany | 17.9 /100 | #194 | Poor 2.5% |
| Immigrants | Southern Europe | 15.6 /100 | #195 | Poor 2.5% |
| Koreans | 15.5 /100 | #196 | Poor 2.5% |
| Crow | 15.2 /100 | #197 | Poor 2.5% |
| Immigrants | Immigrants | 15.0 /100 | #198 | Poor 2.5% |
| Immigrants | Ghana | 14.7 /100 | #199 | Poor 2.5% |
Demographics Similar to Blacks/African Americans by Self-Care Disability
In terms of self-care disability, the demographic groups most similar to Blacks/African Americans are Paiute (2.9%, a difference of 0.070%), Hopi (2.9%, a difference of 0.39%), Cajun (2.9%, a difference of 0.60%), Immigrants from Uzbekistan (2.9%, a difference of 1.0%), and Nepalese (3.0%, a difference of 1.3%).
| Demographics | Rating | Rank | Self-Care Disability |
| Chickasaw | 0.0 /100 | #320 | Tragic 2.9% |
| Navajo | 0.0 /100 | #321 | Tragic 2.9% |
| Comanche | 0.0 /100 | #322 | Tragic 2.9% |
| Seminole | 0.0 /100 | #323 | Tragic 2.9% |
| Cherokee | 0.0 /100 | #324 | Tragic 2.9% |
| Immigrants | Uzbekistan | 0.0 /100 | #325 | Tragic 2.9% |
| Paiute | 0.0 /100 | #326 | Tragic 2.9% |
| Blacks/African Americans | 0.0 /100 | #327 | Tragic 2.9% |
| Hopi | 0.0 /100 | #328 | Tragic 2.9% |
| Cajuns | 0.0 /100 | #329 | Tragic 2.9% |
| Nepalese | 0.0 /100 | #330 | Tragic 3.0% |
| Lumbee | 0.0 /100 | #331 | Tragic 3.0% |
| Kiowa | 0.0 /100 | #332 | Tragic 3.0% |
| Dutch West Indians | 0.0 /100 | #333 | Tragic 3.0% |
| Houma | 0.0 /100 | #334 | Tragic 3.0% |