Somali vs Alaska Native 6th Grade
COMPARE
Somali
Alaska Native
6th Grade
6th Grade Comparison
Somalis
Alaska Natives
96.2%
6TH GRADE
0.1/ 100
METRIC RATING
285th/ 347
METRIC RANK
98.0%
6TH GRADE
100.0/ 100
METRIC RATING
32nd/ 347
METRIC RANK
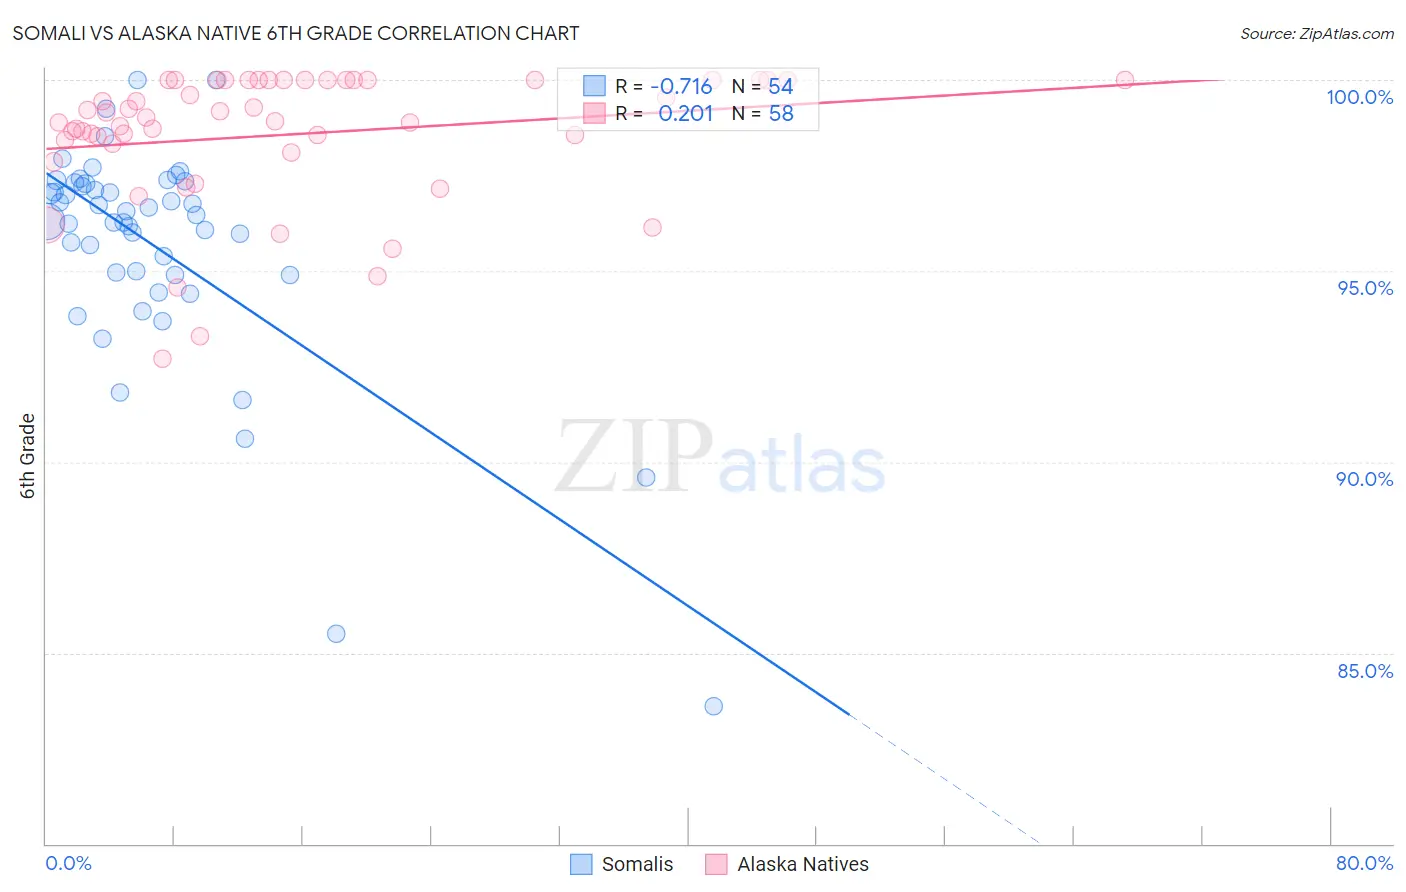
Somali vs Alaska Native 6th Grade Correlation Chart
The statistical analysis conducted on geographies consisting of 99,332,457 people shows a strong negative correlation between the proportion of Somalis and percentage of population with at least 6th grade education in the United States with a correlation coefficient (R) of -0.716 and weighted average of 96.2%. Similarly, the statistical analysis conducted on geographies consisting of 76,778,057 people shows a weak positive correlation between the proportion of Alaska Natives and percentage of population with at least 6th grade education in the United States with a correlation coefficient (R) of 0.201 and weighted average of 98.0%, a difference of 1.8%.
6th Grade Correlation Summary
| Measurement | Somali | Alaska Native |
| Minimum | 83.6% | 92.7% |
| Maximum | 100.0% | 100.0% |
| Range | 16.4% | 7.3% |
| Mean | 95.6% | 98.6% |
| Median | 96.4% | 99.0% |
| Interquartile 25% (IQ1) | 94.9% | 98.3% |
| Interquartile 75% (IQ3) | 97.3% | 100.0% |
| Interquartile Range (IQR) | 2.4% | 1.7% |
| Standard Deviation (Sample) | 3.0% | 1.7% |
| Standard Deviation (Population) | 3.0% | 1.7% |
Similar Demographics by 6th Grade
Demographics Similar to Somalis by 6th Grade
In terms of 6th grade, the demographic groups most similar to Somalis are Fijian (96.2%, a difference of 0.010%), Cuban (96.2%, a difference of 0.020%), Immigrants from Afghanistan (96.2%, a difference of 0.030%), Trinidadian and Tobagonian (96.2%, a difference of 0.030%), and Houma (96.2%, a difference of 0.030%).
| Demographics | Rating | Rank | 6th Grade |
| Immigrants | Thailand | 0.1 /100 | #278 | Tragic 96.3% |
| Immigrants | Peru | 0.1 /100 | #279 | Tragic 96.2% |
| Immigrants | Afghanistan | 0.1 /100 | #280 | Tragic 96.2% |
| Trinidadians and Tobagonians | 0.1 /100 | #281 | Tragic 96.2% |
| Houma | 0.1 /100 | #282 | Tragic 96.2% |
| Cubans | 0.1 /100 | #283 | Tragic 96.2% |
| Fijians | 0.1 /100 | #284 | Tragic 96.2% |
| Somalis | 0.1 /100 | #285 | Tragic 96.2% |
| Barbadians | 0.0 /100 | #286 | Tragic 96.2% |
| Immigrants | Trinidad and Tobago | 0.0 /100 | #287 | Tragic 96.2% |
| Malaysians | 0.0 /100 | #288 | Tragic 96.2% |
| Immigrants | Eritrea | 0.0 /100 | #289 | Tragic 96.1% |
| Immigrants | Somalia | 0.0 /100 | #290 | Tragic 96.1% |
| Immigrants | St. Vincent and the Grenadines | 0.0 /100 | #291 | Tragic 96.1% |
| Immigrants | Barbados | 0.0 /100 | #292 | Tragic 96.1% |
Demographics Similar to Alaska Natives by 6th Grade
In terms of 6th grade, the demographic groups most similar to Alaska Natives are French Canadian (98.0%, a difference of 0.010%), European (98.0%, a difference of 0.010%), Yup'ik (98.0%, a difference of 0.020%), Scandinavian (98.0%, a difference of 0.020%), and French (98.0%, a difference of 0.020%).
| Demographics | Rating | Rank | 6th Grade |
| Scotch-Irish | 100.0 /100 | #25 | Exceptional 98.0% |
| Czechs | 100.0 /100 | #26 | Exceptional 98.0% |
| Yup'ik | 100.0 /100 | #27 | Exceptional 98.0% |
| Scandinavians | 100.0 /100 | #28 | Exceptional 98.0% |
| French | 100.0 /100 | #29 | Exceptional 98.0% |
| French Canadians | 100.0 /100 | #30 | Exceptional 98.0% |
| Europeans | 100.0 /100 | #31 | Exceptional 98.0% |
| Alaska Natives | 100.0 /100 | #32 | Exceptional 98.0% |
| Chippewa | 100.0 /100 | #33 | Exceptional 97.9% |
| Swiss | 100.0 /100 | #34 | Exceptional 97.9% |
| Chinese | 100.0 /100 | #35 | Exceptional 97.9% |
| Italians | 100.0 /100 | #36 | Exceptional 97.9% |
| British | 100.0 /100 | #37 | Exceptional 97.9% |
| Belgians | 100.0 /100 | #38 | Exceptional 97.9% |
| Luxembourgers | 99.9 /100 | #39 | Exceptional 97.9% |