Somali vs Alaska Native Householder Income Ages 45 - 64 years
COMPARE
Somali
Alaska Native
Householder Income Ages 45 - 64 years
Householder Income Ages 45 - 64 years Comparison
Somalis
Alaska Natives
$88,600
HOUSEHOLDER INCOME AGES 45 - 64 YEARS
0.3/ 100
METRIC RATING
262nd/ 347
METRIC RANK
$93,991
HOUSEHOLDER INCOME AGES 45 - 64 YEARS
4.0/ 100
METRIC RATING
227th/ 347
METRIC RANK
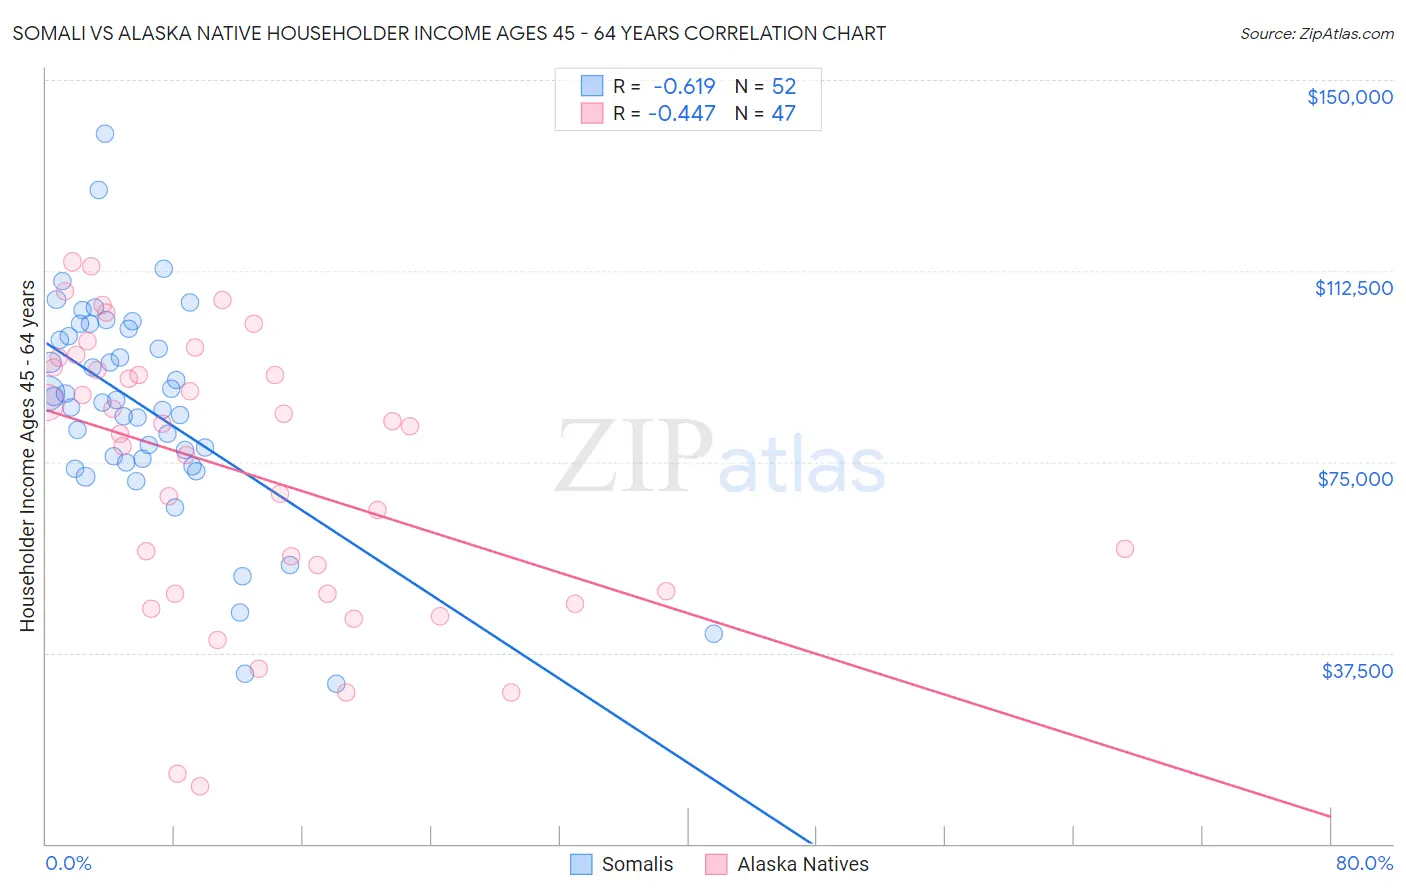
Somali vs Alaska Native Householder Income Ages 45 - 64 years Correlation Chart
The statistical analysis conducted on geographies consisting of 99,239,152 people shows a significant negative correlation between the proportion of Somalis and household income with householder between the ages 45 and 64 in the United States with a correlation coefficient (R) of -0.619 and weighted average of $88,600. Similarly, the statistical analysis conducted on geographies consisting of 76,694,655 people shows a moderate negative correlation between the proportion of Alaska Natives and household income with householder between the ages 45 and 64 in the United States with a correlation coefficient (R) of -0.447 and weighted average of $93,991, a difference of 6.1%.
Householder Income Ages 45 - 64 years Correlation Summary
| Measurement | Somali | Alaska Native |
| Minimum | $31,458 | $11,250 |
| Maximum | $139,513 | $114,284 |
| Range | $108,055 | $103,034 |
| Mean | $85,624 | $73,165 |
| Median | $86,901 | $81,875 |
| Interquartile 25% (IQ1) | $75,206 | $49,167 |
| Interquartile 75% (IQ3) | $100,414 | $93,652 |
| Interquartile Range (IQR) | $25,208 | $44,485 |
| Standard Deviation (Sample) | $21,267 | $27,050 |
| Standard Deviation (Population) | $21,061 | $26,761 |
Similar Demographics by Householder Income Ages 45 - 64 years
Demographics Similar to Somalis by Householder Income Ages 45 - 64 years
In terms of householder income ages 45 - 64 years, the demographic groups most similar to Somalis are Belizean ($88,684, a difference of 0.090%), Immigrants from Senegal ($88,421, a difference of 0.20%), Osage ($88,390, a difference of 0.24%), Jamaican ($88,327, a difference of 0.31%), and Liberian ($88,929, a difference of 0.37%).
| Demographics | Rating | Rank | Householder Income Ages 45 - 64 years |
| West Indians | 0.5 /100 | #255 | Tragic $89,906 |
| French American Indians | 0.5 /100 | #256 | Tragic $89,811 |
| German Russians | 0.4 /100 | #257 | Tragic $89,398 |
| Immigrants | Barbados | 0.4 /100 | #258 | Tragic $89,394 |
| Immigrants | Nicaragua | 0.4 /100 | #259 | Tragic $89,108 |
| Liberians | 0.3 /100 | #260 | Tragic $88,929 |
| Belizeans | 0.3 /100 | #261 | Tragic $88,684 |
| Somalis | 0.3 /100 | #262 | Tragic $88,600 |
| Immigrants | Senegal | 0.3 /100 | #263 | Tragic $88,421 |
| Osage | 0.3 /100 | #264 | Tragic $88,390 |
| Jamaicans | 0.2 /100 | #265 | Tragic $88,327 |
| Immigrants | West Indies | 0.2 /100 | #266 | Tragic $88,164 |
| Hmong | 0.2 /100 | #267 | Tragic $88,115 |
| Immigrants | Micronesia | 0.2 /100 | #268 | Tragic $87,864 |
| Spanish Americans | 0.2 /100 | #269 | Tragic $87,836 |
Demographics Similar to Alaska Natives by Householder Income Ages 45 - 64 years
In terms of householder income ages 45 - 64 years, the demographic groups most similar to Alaska Natives are Immigrants from the Azores ($94,138, a difference of 0.16%), Immigrants from Panama ($93,815, a difference of 0.19%), Bermudan ($94,197, a difference of 0.22%), Vietnamese ($93,788, a difference of 0.22%), and Immigrants from Sudan ($93,781, a difference of 0.22%).
| Demographics | Rating | Rank | Householder Income Ages 45 - 64 years |
| Salvadorans | 6.0 /100 | #220 | Tragic $94,842 |
| Immigrants | Nigeria | 5.9 /100 | #221 | Tragic $94,804 |
| Malaysians | 5.2 /100 | #222 | Tragic $94,517 |
| Immigrants | Nonimmigrants | 5.0 /100 | #223 | Tragic $94,448 |
| Immigrants | Bosnia and Herzegovina | 4.6 /100 | #224 | Tragic $94,288 |
| Bermudans | 4.4 /100 | #225 | Tragic $94,197 |
| Immigrants | Azores | 4.3 /100 | #226 | Tragic $94,138 |
| Alaska Natives | 4.0 /100 | #227 | Tragic $93,991 |
| Immigrants | Panama | 3.7 /100 | #228 | Tragic $93,815 |
| Vietnamese | 3.6 /100 | #229 | Tragic $93,788 |
| Immigrants | Sudan | 3.6 /100 | #230 | Tragic $93,781 |
| Ecuadorians | 3.6 /100 | #231 | Tragic $93,739 |
| Sudanese | 3.5 /100 | #232 | Tragic $93,718 |
| Nepalese | 3.0 /100 | #233 | Tragic $93,355 |
| Immigrants | El Salvador | 2.7 /100 | #234 | Tragic $93,176 |