Somali vs Alaska Native Doctorate Degree
COMPARE
Somali
Alaska Native
Doctorate Degree
Doctorate Degree Comparison
Somalis
Alaska Natives
1.7%
DOCTORATE DEGREE
21.2/ 100
METRIC RATING
204th/ 347
METRIC RANK
1.4%
DOCTORATE DEGREE
0.3/ 100
METRIC RATING
292nd/ 347
METRIC RANK
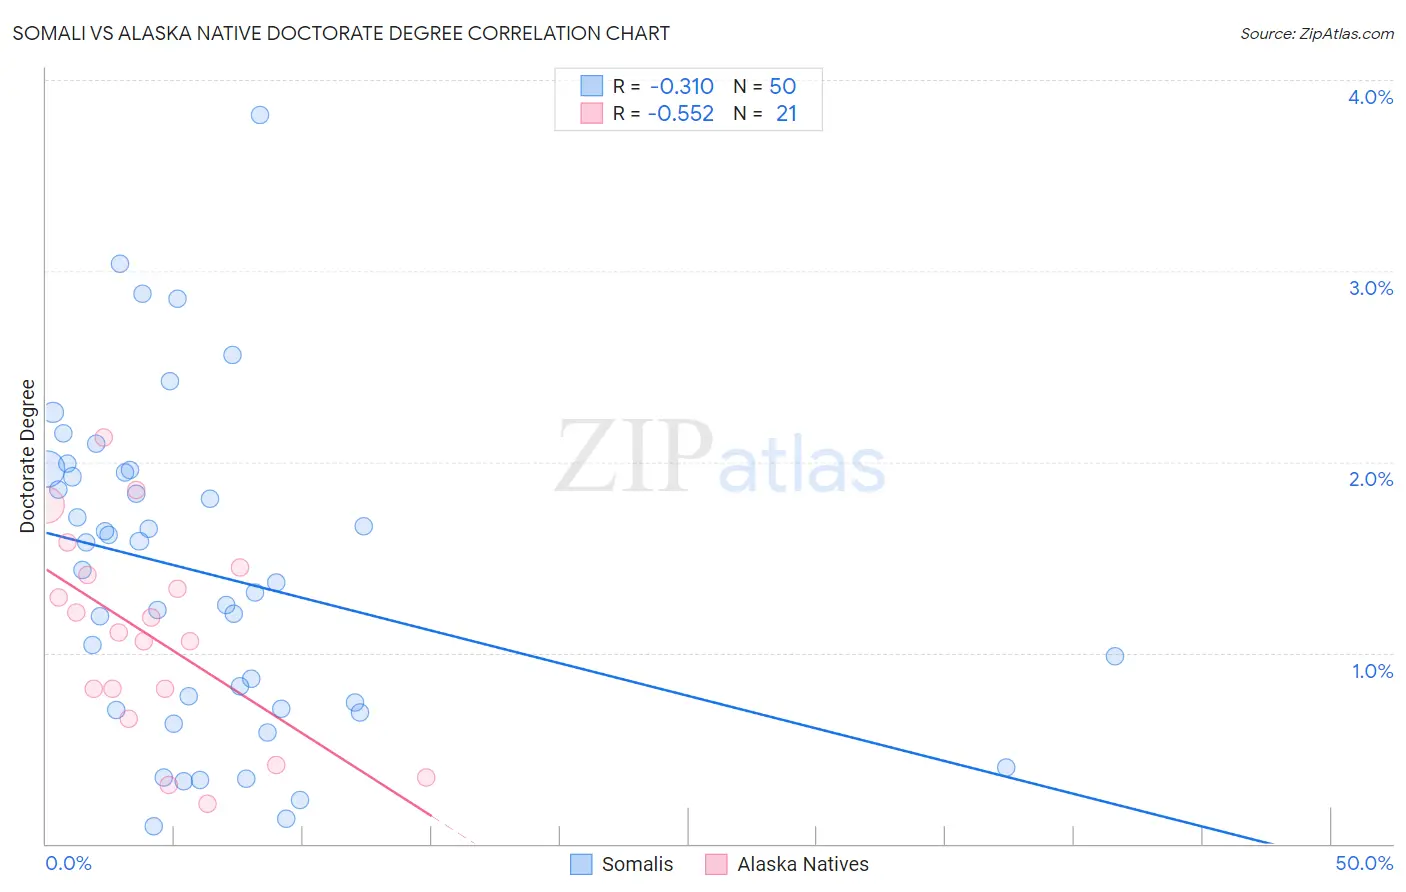
Somali vs Alaska Native Doctorate Degree Correlation Chart
The statistical analysis conducted on geographies consisting of 99,087,953 people shows a mild negative correlation between the proportion of Somalis and percentage of population with at least doctorate degree education in the United States with a correlation coefficient (R) of -0.310 and weighted average of 1.7%. Similarly, the statistical analysis conducted on geographies consisting of 76,370,977 people shows a substantial negative correlation between the proportion of Alaska Natives and percentage of population with at least doctorate degree education in the United States with a correlation coefficient (R) of -0.552 and weighted average of 1.4%, a difference of 21.5%.
Doctorate Degree Correlation Summary
| Measurement | Somali | Alaska Native |
| Minimum | 0.094% | 0.21% |
| Maximum | 3.8% | 2.1% |
| Range | 3.7% | 1.9% |
| Mean | 1.4% | 1.1% |
| Median | 1.4% | 1.1% |
| Interquartile 25% (IQ1) | 0.70% | 0.73% |
| Interquartile 75% (IQ3) | 1.9% | 1.4% |
| Interquartile Range (IQR) | 1.2% | 0.69% |
| Standard Deviation (Sample) | 0.84% | 0.53% |
| Standard Deviation (Population) | 0.83% | 0.51% |
Similar Demographics by Doctorate Degree
Demographics Similar to Somalis by Doctorate Degree
In terms of doctorate degree, the demographic groups most similar to Somalis are Immigrants from Vietnam (1.8%, a difference of 0.030%), Portuguese (1.8%, a difference of 0.050%), Immigrants from Nigeria (1.8%, a difference of 0.28%), White/Caucasian (1.8%, a difference of 0.35%), and Venezuelan (1.7%, a difference of 0.41%).
| Demographics | Rating | Rank | Doctorate Degree |
| Chinese | 25.1 /100 | #197 | Fair 1.8% |
| Immigrants | Ghana | 24.6 /100 | #198 | Fair 1.8% |
| Immigrants | South America | 23.3 /100 | #199 | Fair 1.8% |
| Whites/Caucasians | 22.8 /100 | #200 | Fair 1.8% |
| Immigrants | Nigeria | 22.4 /100 | #201 | Fair 1.8% |
| Portuguese | 21.4 /100 | #202 | Fair 1.8% |
| Immigrants | Vietnam | 21.4 /100 | #203 | Fair 1.8% |
| Somalis | 21.2 /100 | #204 | Fair 1.7% |
| Venezuelans | 19.5 /100 | #205 | Poor 1.7% |
| Immigrants | Peru | 17.6 /100 | #206 | Poor 1.7% |
| Yugoslavians | 17.1 /100 | #207 | Poor 1.7% |
| Colombians | 16.1 /100 | #208 | Poor 1.7% |
| Immigrants | Western Africa | 15.4 /100 | #209 | Poor 1.7% |
| Tongans | 15.1 /100 | #210 | Poor 1.7% |
| Immigrants | Armenia | 15.1 /100 | #211 | Poor 1.7% |
Demographics Similar to Alaska Natives by Doctorate Degree
In terms of doctorate degree, the demographic groups most similar to Alaska Natives are Black/African American (1.4%, a difference of 0.17%), Choctaw (1.4%, a difference of 0.40%), Cape Verdean (1.4%, a difference of 0.42%), Immigrants from El Salvador (1.4%, a difference of 0.55%), and Immigrants from Yemen (1.4%, a difference of 0.59%).
| Demographics | Rating | Rank | Doctorate Degree |
| Malaysians | 0.3 /100 | #285 | Tragic 1.5% |
| Cherokee | 0.3 /100 | #286 | Tragic 1.5% |
| Cajuns | 0.3 /100 | #287 | Tragic 1.5% |
| Immigrants | El Salvador | 0.3 /100 | #288 | Tragic 1.4% |
| Cape Verdeans | 0.3 /100 | #289 | Tragic 1.4% |
| Choctaw | 0.3 /100 | #290 | Tragic 1.4% |
| Blacks/African Americans | 0.3 /100 | #291 | Tragic 1.4% |
| Alaska Natives | 0.3 /100 | #292 | Tragic 1.4% |
| Immigrants | Yemen | 0.2 /100 | #293 | Tragic 1.4% |
| Samoans | 0.2 /100 | #294 | Tragic 1.4% |
| Guatemalans | 0.2 /100 | #295 | Tragic 1.4% |
| Immigrants | Ecuador | 0.2 /100 | #296 | Tragic 1.4% |
| Tsimshian | 0.2 /100 | #297 | Tragic 1.4% |
| Puerto Ricans | 0.1 /100 | #298 | Tragic 1.4% |
| Belizeans | 0.1 /100 | #299 | Tragic 1.4% |