Slavic vs Bermudan Vision Disability
COMPARE
Slavic
Bermudan
Vision Disability
Vision Disability Comparison
Slavs
Bermudans
2.2%
VISION DISABILITY
46.0/ 100
METRIC RATING
177th/ 347
METRIC RANK
2.2%
VISION DISABILITY
9.0/ 100
METRIC RATING
212th/ 347
METRIC RANK
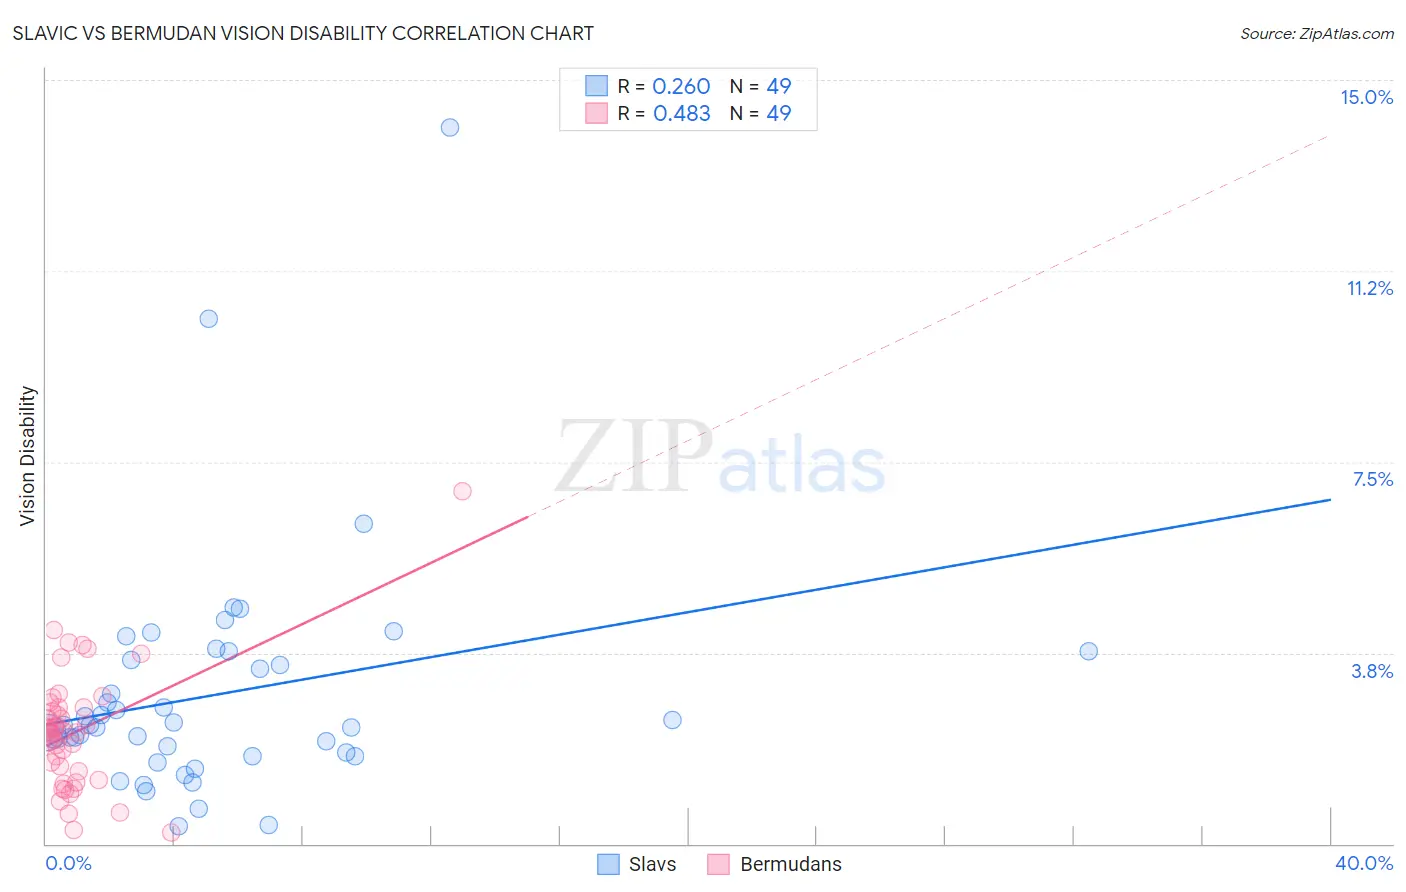
Slavic vs Bermudan Vision Disability Correlation Chart
The statistical analysis conducted on geographies consisting of 270,742,725 people shows a weak positive correlation between the proportion of Slavs and percentage of population with vision disability in the United States with a correlation coefficient (R) of 0.260 and weighted average of 2.2%. Similarly, the statistical analysis conducted on geographies consisting of 55,718,331 people shows a moderate positive correlation between the proportion of Bermudans and percentage of population with vision disability in the United States with a correlation coefficient (R) of 0.483 and weighted average of 2.2%, a difference of 3.4%.
Vision Disability Correlation Summary
| Measurement | Slavic | Bermudan |
| Minimum | 0.34% | 0.22% |
| Maximum | 14.1% | 6.9% |
| Range | 13.7% | 6.7% |
| Mean | 2.9% | 2.2% |
| Median | 2.3% | 2.2% |
| Interquartile 25% (IQ1) | 1.8% | 1.3% |
| Interquartile 75% (IQ3) | 3.7% | 2.7% |
| Interquartile Range (IQR) | 1.9% | 1.3% |
| Standard Deviation (Sample) | 2.3% | 1.2% |
| Standard Deviation (Population) | 2.3% | 1.2% |
Similar Demographics by Vision Disability
Demographics Similar to Slavs by Vision Disability
In terms of vision disability, the demographic groups most similar to Slavs are Yugoslavian (2.2%, a difference of 0.040%), Immigrants from Oceania (2.2%, a difference of 0.050%), Immigrants from North America (2.2%, a difference of 0.090%), Immigrants from Fiji (2.2%, a difference of 0.11%), and Uruguayan (2.2%, a difference of 0.21%).
| Demographics | Rating | Rank | Vision Disability |
| Swiss | 55.7 /100 | #170 | Average 2.2% |
| Lebanese | 54.3 /100 | #171 | Average 2.2% |
| Northern Europeans | 50.1 /100 | #172 | Average 2.2% |
| Scandinavians | 50.0 /100 | #173 | Average 2.2% |
| Immigrants | Canada | 50.0 /100 | #174 | Average 2.2% |
| Immigrants | Fiji | 47.6 /100 | #175 | Average 2.2% |
| Yugoslavians | 46.5 /100 | #176 | Average 2.2% |
| Slavs | 46.0 /100 | #177 | Average 2.2% |
| Immigrants | Oceania | 45.1 /100 | #178 | Average 2.2% |
| Immigrants | North America | 44.5 /100 | #179 | Average 2.2% |
| Uruguayans | 42.7 /100 | #180 | Average 2.2% |
| Immigrants | Western Europe | 41.1 /100 | #181 | Average 2.2% |
| Costa Ricans | 40.7 /100 | #182 | Average 2.2% |
| Immigrants | Burma/Myanmar | 37.9 /100 | #183 | Fair 2.2% |
| Moroccans | 35.4 /100 | #184 | Fair 2.2% |
Demographics Similar to Bermudans by Vision Disability
In terms of vision disability, the demographic groups most similar to Bermudans are Immigrants from Ghana (2.2%, a difference of 0.010%), Indonesian (2.2%, a difference of 0.090%), Trinidadian and Tobagonian (2.2%, a difference of 0.14%), Nigerian (2.3%, a difference of 0.35%), and Immigrants from Uruguay (2.2%, a difference of 0.43%).
| Demographics | Rating | Rank | Vision Disability |
| Samoans | 15.7 /100 | #205 | Poor 2.2% |
| Pennsylvania Germans | 14.5 /100 | #206 | Poor 2.2% |
| Immigrants | Nigeria | 13.5 /100 | #207 | Poor 2.2% |
| Germans | 13.4 /100 | #208 | Poor 2.2% |
| Immigrants | Brazil | 13.1 /100 | #209 | Poor 2.2% |
| Immigrants | Uruguay | 11.5 /100 | #210 | Poor 2.2% |
| Indonesians | 9.5 /100 | #211 | Tragic 2.2% |
| Bermudans | 9.0 /100 | #212 | Tragic 2.2% |
| Immigrants | Ghana | 8.9 /100 | #213 | Tragic 2.2% |
| Trinidadians and Tobagonians | 8.2 /100 | #214 | Tragic 2.2% |
| Nigerians | 7.2 /100 | #215 | Tragic 2.3% |
| Immigrants | Trinidad and Tobago | 6.1 /100 | #216 | Tragic 2.3% |
| Barbadians | 5.1 /100 | #217 | Tragic 2.3% |
| Portuguese | 4.9 /100 | #218 | Tragic 2.3% |
| Ecuadorians | 4.6 /100 | #219 | Tragic 2.3% |