Slavic vs Bermudan Unemployment Among Ages 65 to 74 years
COMPARE
Slavic
Bermudan
Unemployment Among Ages 65 to 74 years
Unemployment Among Ages 65 to 74 years Comparison
Slavs
Bermudans
5.2%
UNEMPLOYMENT AMONG AGES 65 TO 74 YEARS
98.7/ 100
METRIC RATING
79th/ 347
METRIC RANK
6.3%
UNEMPLOYMENT AMONG AGES 65 TO 74 YEARS
0.0/ 100
METRIC RATING
331st/ 347
METRIC RANK
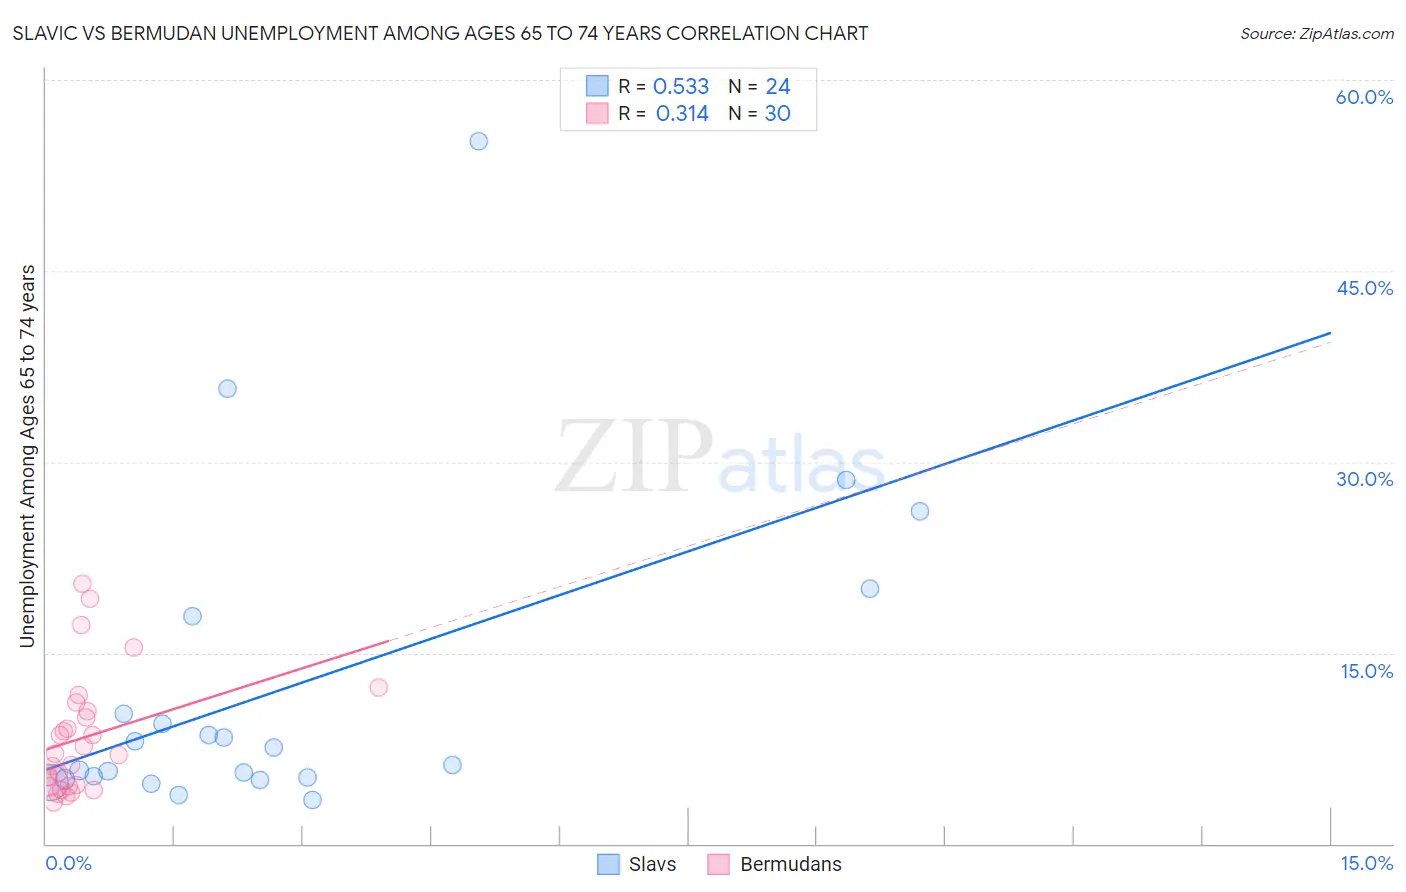
Slavic vs Bermudan Unemployment Among Ages 65 to 74 years Correlation Chart
The statistical analysis conducted on geographies consisting of 244,532,662 people shows a substantial positive correlation between the proportion of Slavs and unemployment rate among population between the ages 65 and 74 in the United States with a correlation coefficient (R) of 0.533 and weighted average of 5.2%. Similarly, the statistical analysis conducted on geographies consisting of 54,099,424 people shows a mild positive correlation between the proportion of Bermudans and unemployment rate among population between the ages 65 and 74 in the United States with a correlation coefficient (R) of 0.314 and weighted average of 6.3%, a difference of 21.2%.
Unemployment Among Ages 65 to 74 years Correlation Summary
| Measurement | Slavic | Bermudan |
| Minimum | 3.4% | 3.2% |
| Maximum | 55.2% | 20.4% |
| Range | 51.8% | 17.2% |
| Mean | 12.3% | 8.3% |
| Median | 6.9% | 7.1% |
| Interquartile 25% (IQ1) | 5.1% | 4.5% |
| Interquartile 75% (IQ3) | 14.0% | 10.4% |
| Interquartile Range (IQR) | 8.9% | 5.9% |
| Standard Deviation (Sample) | 12.6% | 4.7% |
| Standard Deviation (Population) | 12.3% | 4.6% |
Similar Demographics by Unemployment Among Ages 65 to 74 years
Demographics Similar to Slavs by Unemployment Among Ages 65 to 74 years
In terms of unemployment among ages 65 to 74 years, the demographic groups most similar to Slavs are Immigrants from South Africa (5.2%, a difference of 0.020%), Immigrants from Scotland (5.2%, a difference of 0.030%), Thai (5.2%, a difference of 0.030%), Immigrants from Middle Africa (5.2%, a difference of 0.18%), and Northern European (5.2%, a difference of 0.19%).
| Demographics | Rating | Rank | Unemployment Among Ages 65 to 74 years |
| Immigrants | Oceania | 99.0 /100 | #72 | Exceptional 5.2% |
| Filipinos | 99.0 /100 | #73 | Exceptional 5.2% |
| Afghans | 99.0 /100 | #74 | Exceptional 5.2% |
| Okinawans | 99.0 /100 | #75 | Exceptional 5.2% |
| Estonians | 99.0 /100 | #76 | Exceptional 5.2% |
| Immigrants | Sudan | 98.9 /100 | #77 | Exceptional 5.2% |
| Northern Europeans | 98.9 /100 | #78 | Exceptional 5.2% |
| Slavs | 98.7 /100 | #79 | Exceptional 5.2% |
| Immigrants | South Africa | 98.6 /100 | #80 | Exceptional 5.2% |
| Immigrants | Scotland | 98.6 /100 | #81 | Exceptional 5.2% |
| Thais | 98.6 /100 | #82 | Exceptional 5.2% |
| Immigrants | Middle Africa | 98.4 /100 | #83 | Exceptional 5.2% |
| Immigrants | Hungary | 98.0 /100 | #84 | Exceptional 5.2% |
| British | 97.9 /100 | #85 | Exceptional 5.2% |
| Danes | 97.9 /100 | #86 | Exceptional 5.2% |
Demographics Similar to Bermudans by Unemployment Among Ages 65 to 74 years
In terms of unemployment among ages 65 to 74 years, the demographic groups most similar to Bermudans are Dominican (6.3%, a difference of 0.14%), Immigrants from Dominican Republic (6.3%, a difference of 0.32%), Paiute (6.3%, a difference of 0.42%), Yuman (6.2%, a difference of 0.45%), and Taiwanese (6.3%, a difference of 0.53%).
| Demographics | Rating | Rank | Unemployment Among Ages 65 to 74 years |
| Tohono O'odham | 0.0 /100 | #324 | Tragic 6.0% |
| Immigrants | Portugal | 0.0 /100 | #325 | Tragic 6.0% |
| Natives/Alaskans | 0.0 /100 | #326 | Tragic 6.0% |
| Shoshone | 0.0 /100 | #327 | Tragic 6.2% |
| Immigrants | Azores | 0.0 /100 | #328 | Tragic 6.2% |
| Yuman | 0.0 /100 | #329 | Tragic 6.2% |
| Dominicans | 0.0 /100 | #330 | Tragic 6.3% |
| Bermudans | 0.0 /100 | #331 | Tragic 6.3% |
| Immigrants | Dominican Republic | 0.0 /100 | #332 | Tragic 6.3% |
| Paiute | 0.0 /100 | #333 | Tragic 6.3% |
| Taiwanese | 0.0 /100 | #334 | Tragic 6.3% |
| Puerto Ricans | 0.0 /100 | #335 | Tragic 6.4% |
| Immigrants | Armenia | 0.0 /100 | #336 | Tragic 6.5% |
| Ute | 0.0 /100 | #337 | Tragic 6.5% |
| Tlingit-Haida | 0.0 /100 | #338 | Tragic 6.5% |