New Zealander vs Russian Disability
COMPARE
New Zealander
Russian
Disability
Disability Comparison
New Zealanders
Russians
11.5%
DISABILITY
87.0/ 100
METRIC RATING
138th/ 347
METRIC RANK
11.5%
DISABILITY
86.8/ 100
METRIC RATING
140th/ 347
METRIC RANK
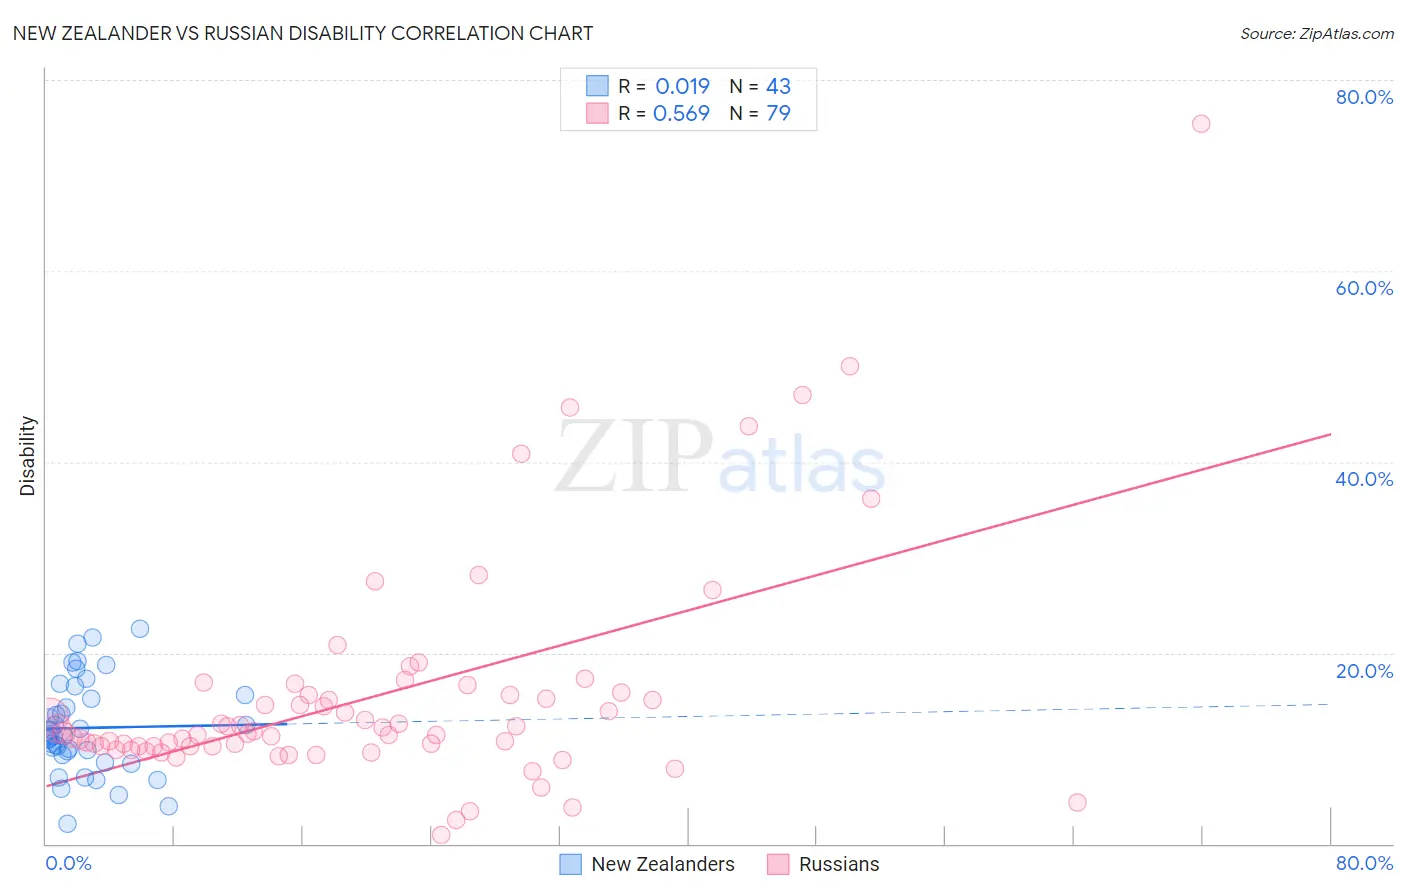
New Zealander vs Russian Disability Correlation Chart
The statistical analysis conducted on geographies consisting of 106,922,705 people shows no correlation between the proportion of New Zealanders and percentage of population with a disability in the United States with a correlation coefficient (R) of 0.019 and weighted average of 11.5%. Similarly, the statistical analysis conducted on geographies consisting of 512,171,933 people shows a substantial positive correlation between the proportion of Russians and percentage of population with a disability in the United States with a correlation coefficient (R) of 0.569 and weighted average of 11.5%, a difference of 0.020%.
Disability Correlation Summary
| Measurement | New Zealander | Russian |
| Minimum | 2.1% | 0.92% |
| Maximum | 22.5% | 75.4% |
| Range | 20.4% | 74.5% |
| Mean | 12.1% | 15.4% |
| Median | 11.3% | 11.6% |
| Interquartile 25% (IQ1) | 9.2% | 10.2% |
| Interquartile 75% (IQ3) | 15.6% | 15.6% |
| Interquartile Range (IQR) | 6.4% | 5.4% |
| Standard Deviation (Sample) | 4.9% | 11.9% |
| Standard Deviation (Population) | 4.8% | 11.8% |
Demographics Similar to New Zealanders and Russians by Disability
In terms of disability, the demographic groups most similar to New Zealanders are Ghanaian (11.5%, a difference of 0.0%), Kenyan (11.5%, a difference of 0.010%), Immigrants from St. Vincent and the Grenadines (11.4%, a difference of 0.080%), Ugandan (11.4%, a difference of 0.090%), and Immigrants from Grenada (11.5%, a difference of 0.090%). Similarly, the demographic groups most similar to Russians are Ghanaian (11.5%, a difference of 0.020%), Kenyan (11.5%, a difference of 0.030%), Immigrants from Grenada (11.5%, a difference of 0.070%), Immigrants from St. Vincent and the Grenadines (11.4%, a difference of 0.10%), and Ugandan (11.4%, a difference of 0.11%).
| Demographics | Rating | Rank | Disability |
| Macedonians | 90.3 /100 | #129 | Exceptional 11.4% |
| Latvians | 89.8 /100 | #130 | Excellent 11.4% |
| Immigrants | Croatia | 89.8 /100 | #131 | Excellent 11.4% |
| Immigrants | Africa | 89.3 /100 | #132 | Excellent 11.4% |
| Arabs | 89.1 /100 | #133 | Excellent 11.4% |
| Immigrants | Guyana | 88.3 /100 | #134 | Excellent 11.4% |
| Ugandans | 87.9 /100 | #135 | Excellent 11.4% |
| Immigrants | St. Vincent and the Grenadines | 87.8 /100 | #136 | Excellent 11.4% |
| Kenyans | 87.1 /100 | #137 | Excellent 11.5% |
| New Zealanders | 87.0 /100 | #138 | Excellent 11.5% |
| Ghanaians | 87.0 /100 | #139 | Excellent 11.5% |
| Russians | 86.8 /100 | #140 | Excellent 11.5% |
| Immigrants | Grenada | 86.1 /100 | #141 | Excellent 11.5% |
| Immigrants | Sudan | 85.3 /100 | #142 | Excellent 11.5% |
| Moroccans | 83.3 /100 | #143 | Excellent 11.5% |
| Australians | 82.5 /100 | #144 | Excellent 11.5% |
| Nigerians | 81.3 /100 | #145 | Excellent 11.5% |
| Immigrants | Hungary | 79.0 /100 | #146 | Good 11.5% |
| Immigrants | Ukraine | 77.6 /100 | #147 | Good 11.5% |
| Sudanese | 77.1 /100 | #148 | Good 11.5% |
| Immigrants | Norway | 73.2 /100 | #149 | Good 11.6% |