Sioux vs Russian Single Mother Households
COMPARE
Sioux
Russian
Single Mother Households
Single Mother Households Comparison
Sioux
Russians
8.5%
SINGLE MOTHER HOUSEHOLDS
0.0/ 100
METRIC RATING
331st/ 347
METRIC RANK
5.3%
SINGLE MOTHER HOUSEHOLDS
99.7/ 100
METRIC RATING
28th/ 347
METRIC RANK
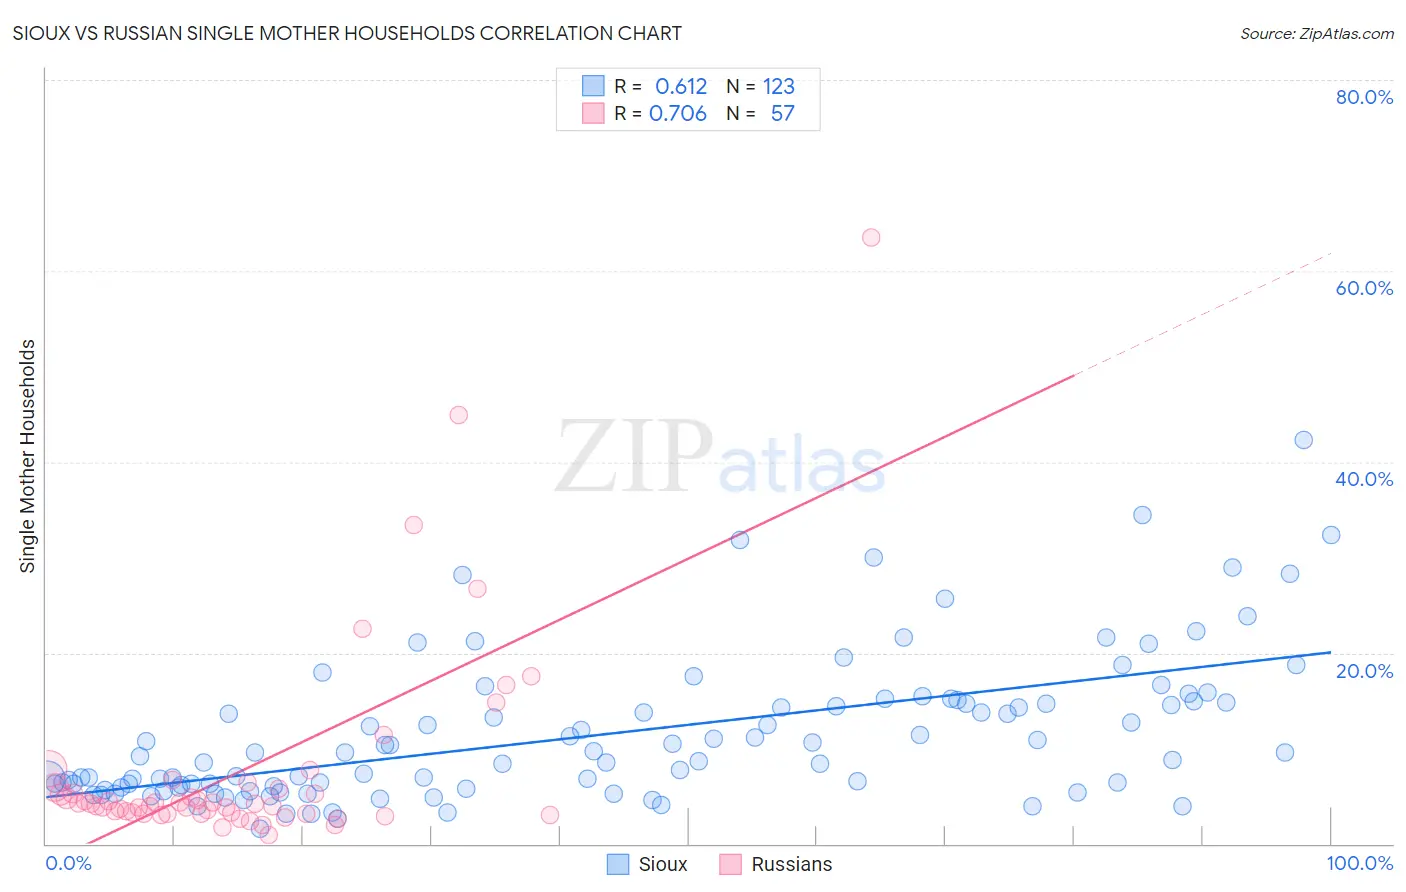
Sioux vs Russian Single Mother Households Correlation Chart
The statistical analysis conducted on geographies consisting of 233,811,007 people shows a significant positive correlation between the proportion of Sioux and percentage of single mother households in the United States with a correlation coefficient (R) of 0.612 and weighted average of 8.5%. Similarly, the statistical analysis conducted on geographies consisting of 509,106,631 people shows a strong positive correlation between the proportion of Russians and percentage of single mother households in the United States with a correlation coefficient (R) of 0.706 and weighted average of 5.3%, a difference of 60.6%.
Single Mother Households Correlation Summary
| Measurement | Sioux | Russian |
| Minimum | 1.6% | 0.89% |
| Maximum | 42.3% | 63.5% |
| Range | 40.7% | 62.6% |
| Mean | 11.4% | 7.8% |
| Median | 9.1% | 4.2% |
| Interquartile 25% (IQ1) | 5.9% | 3.2% |
| Interquartile 75% (IQ3) | 14.8% | 5.8% |
| Interquartile Range (IQR) | 8.9% | 2.6% |
| Standard Deviation (Sample) | 7.6% | 11.0% |
| Standard Deviation (Population) | 7.6% | 10.9% |
Similar Demographics by Single Mother Households
Demographics Similar to Sioux by Single Mother Households
In terms of single mother households, the demographic groups most similar to Sioux are Inupiat (8.5%, a difference of 0.0%), Hopi (8.5%, a difference of 0.11%), Yakama (8.4%, a difference of 0.86%), Immigrants from Haiti (8.4%, a difference of 1.0%), and British West Indian (8.4%, a difference of 1.2%).
| Demographics | Rating | Rank | Single Mother Households |
| Immigrants | Jamaica | 0.0 /100 | #324 | Tragic 8.4% |
| Immigrants | Caribbean | 0.0 /100 | #325 | Tragic 8.4% |
| British West Indians | 0.0 /100 | #326 | Tragic 8.4% |
| Immigrants | Haiti | 0.0 /100 | #327 | Tragic 8.4% |
| Yakama | 0.0 /100 | #328 | Tragic 8.4% |
| Hopi | 0.0 /100 | #329 | Tragic 8.5% |
| Inupiat | 0.0 /100 | #330 | Tragic 8.5% |
| Sioux | 0.0 /100 | #331 | Tragic 8.5% |
| U.S. Virgin Islanders | 0.0 /100 | #332 | Tragic 8.6% |
| Liberians | 0.0 /100 | #333 | Tragic 8.6% |
| Immigrants | Liberia | 0.0 /100 | #334 | Tragic 8.7% |
| Immigrants | Dominica | 0.0 /100 | #335 | Tragic 8.7% |
| Puerto Ricans | 0.0 /100 | #336 | Tragic 8.7% |
| Navajo | 0.0 /100 | #337 | Tragic 8.8% |
| Cape Verdeans | 0.0 /100 | #338 | Tragic 8.9% |
Demographics Similar to Russians by Single Mother Households
In terms of single mother households, the demographic groups most similar to Russians are Latvian (5.3%, a difference of 0.010%), Burmese (5.3%, a difference of 0.080%), Immigrants from Korea (5.3%, a difference of 0.080%), Cambodian (5.3%, a difference of 0.090%), and Bhutanese (5.3%, a difference of 0.10%).
| Demographics | Rating | Rank | Single Mother Households |
| Eastern Europeans | 99.8 /100 | #21 | Exceptional 5.2% |
| Thais | 99.8 /100 | #22 | Exceptional 5.2% |
| Immigrants | Austria | 99.8 /100 | #23 | Exceptional 5.2% |
| Armenians | 99.8 /100 | #24 | Exceptional 5.2% |
| Immigrants | Japan | 99.8 /100 | #25 | Exceptional 5.2% |
| Immigrants | Lithuania | 99.8 /100 | #26 | Exceptional 5.3% |
| Bhutanese | 99.7 /100 | #27 | Exceptional 5.3% |
| Russians | 99.7 /100 | #28 | Exceptional 5.3% |
| Latvians | 99.7 /100 | #29 | Exceptional 5.3% |
| Burmese | 99.7 /100 | #30 | Exceptional 5.3% |
| Immigrants | Korea | 99.7 /100 | #31 | Exceptional 5.3% |
| Cambodians | 99.7 /100 | #32 | Exceptional 5.3% |
| Immigrants | Switzerland | 99.7 /100 | #33 | Exceptional 5.3% |
| Bulgarians | 99.7 /100 | #34 | Exceptional 5.3% |
| Immigrants | Northern Europe | 99.7 /100 | #35 | Exceptional 5.3% |