Immigrants from Scotland vs Russian Disability
COMPARE
Immigrants from Scotland
Russian
Disability
Disability Comparison
Immigrants from Scotland
Russians
11.8%
DISABILITY
28.2/ 100
METRIC RATING
186th/ 347
METRIC RANK
11.5%
DISABILITY
86.8/ 100
METRIC RATING
140th/ 347
METRIC RANK
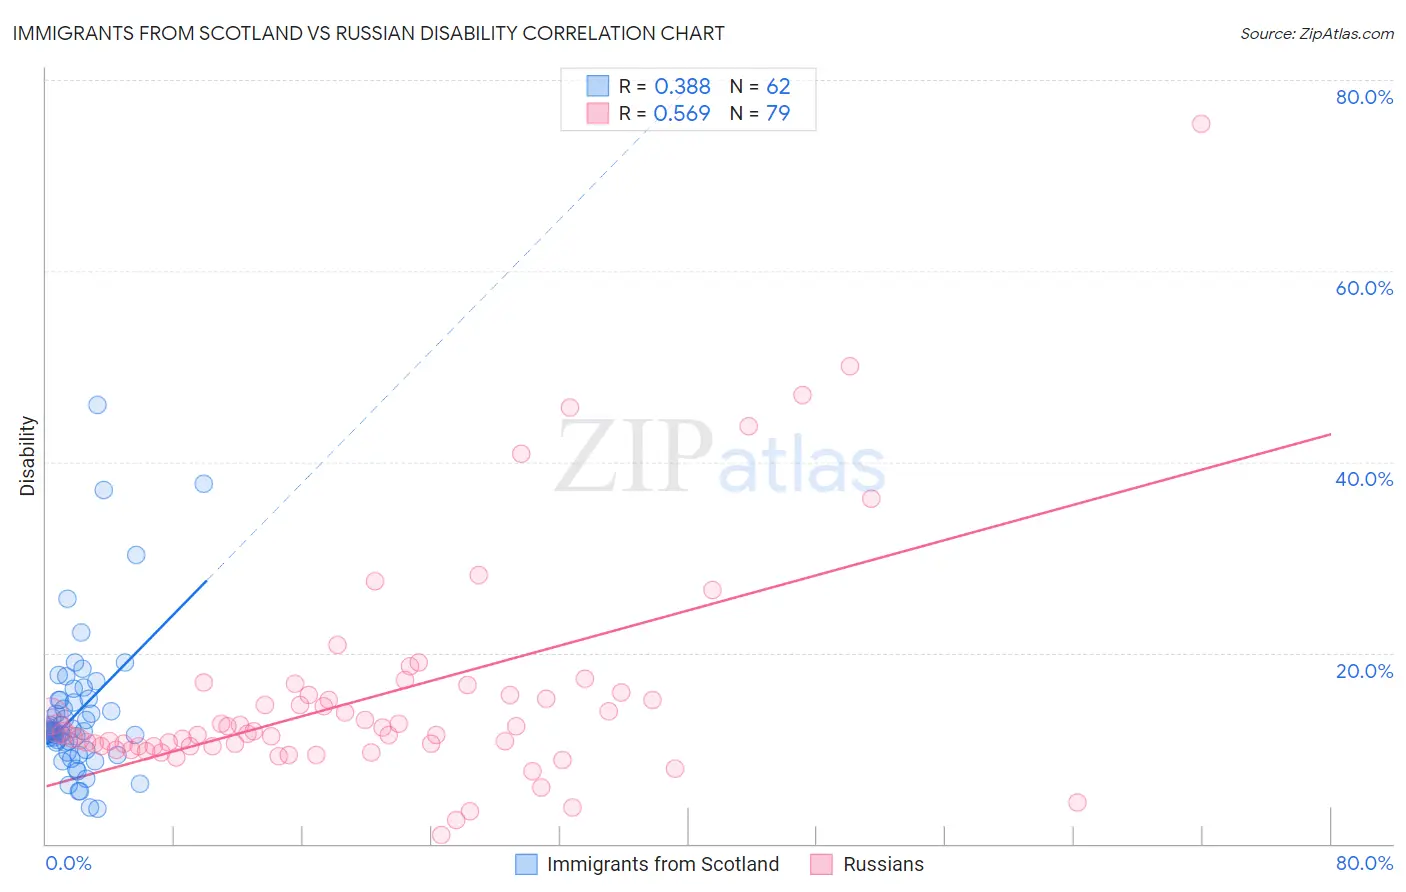
Immigrants from Scotland vs Russian Disability Correlation Chart
The statistical analysis conducted on geographies consisting of 196,399,037 people shows a mild positive correlation between the proportion of Immigrants from Scotland and percentage of population with a disability in the United States with a correlation coefficient (R) of 0.388 and weighted average of 11.8%. Similarly, the statistical analysis conducted on geographies consisting of 512,171,933 people shows a substantial positive correlation between the proportion of Russians and percentage of population with a disability in the United States with a correlation coefficient (R) of 0.569 and weighted average of 11.5%, a difference of 3.2%.
Disability Correlation Summary
| Measurement | Immigrants from Scotland | Russian |
| Minimum | 3.7% | 0.92% |
| Maximum | 46.0% | 75.4% |
| Range | 42.3% | 74.5% |
| Mean | 13.8% | 15.4% |
| Median | 11.8% | 11.6% |
| Interquartile 25% (IQ1) | 9.9% | 10.2% |
| Interquartile 75% (IQ3) | 15.1% | 15.6% |
| Interquartile Range (IQR) | 5.2% | 5.4% |
| Standard Deviation (Sample) | 7.7% | 11.9% |
| Standard Deviation (Population) | 7.6% | 11.8% |
Similar Demographics by Disability
Demographics Similar to Immigrants from Scotland by Disability
In terms of disability, the demographic groups most similar to Immigrants from Scotland are Immigrants from Burma/Myanmar (11.8%, a difference of 0.010%), Lebanese (11.8%, a difference of 0.020%), Iraqi (11.8%, a difference of 0.090%), Honduran (11.8%, a difference of 0.16%), and Immigrants from Mexico (11.9%, a difference of 0.26%).
| Demographics | Rating | Rank | Disability |
| Immigrants | Armenia | 41.9 /100 | #179 | Average 11.7% |
| Immigrants | Honduras | 37.8 /100 | #180 | Fair 11.8% |
| Immigrants | Oceania | 34.3 /100 | #181 | Fair 11.8% |
| Icelanders | 34.0 /100 | #182 | Fair 11.8% |
| Hondurans | 31.2 /100 | #183 | Fair 11.8% |
| Iraqis | 30.0 /100 | #184 | Fair 11.8% |
| Immigrants | Burma/Myanmar | 28.5 /100 | #185 | Fair 11.8% |
| Immigrants | Scotland | 28.2 /100 | #186 | Fair 11.8% |
| Lebanese | 27.9 /100 | #187 | Fair 11.8% |
| Immigrants | Mexico | 23.8 /100 | #188 | Fair 11.9% |
| Immigrants | Zaire | 21.8 /100 | #189 | Fair 11.9% |
| Immigrants | West Indies | 21.1 /100 | #190 | Fair 11.9% |
| Ute | 19.5 /100 | #191 | Poor 11.9% |
| Lithuanians | 18.8 /100 | #192 | Poor 11.9% |
| Immigrants | Bosnia and Herzegovina | 18.0 /100 | #193 | Poor 11.9% |
Demographics Similar to Russians by Disability
In terms of disability, the demographic groups most similar to Russians are New Zealander (11.5%, a difference of 0.020%), Ghanaian (11.5%, a difference of 0.020%), Kenyan (11.5%, a difference of 0.030%), Immigrants from Grenada (11.5%, a difference of 0.070%), and Immigrants from St. Vincent and the Grenadines (11.4%, a difference of 0.10%).
| Demographics | Rating | Rank | Disability |
| Arabs | 89.1 /100 | #133 | Excellent 11.4% |
| Immigrants | Guyana | 88.3 /100 | #134 | Excellent 11.4% |
| Ugandans | 87.9 /100 | #135 | Excellent 11.4% |
| Immigrants | St. Vincent and the Grenadines | 87.8 /100 | #136 | Excellent 11.4% |
| Kenyans | 87.1 /100 | #137 | Excellent 11.5% |
| New Zealanders | 87.0 /100 | #138 | Excellent 11.5% |
| Ghanaians | 87.0 /100 | #139 | Excellent 11.5% |
| Russians | 86.8 /100 | #140 | Excellent 11.5% |
| Immigrants | Grenada | 86.1 /100 | #141 | Excellent 11.5% |
| Immigrants | Sudan | 85.3 /100 | #142 | Excellent 11.5% |
| Moroccans | 83.3 /100 | #143 | Excellent 11.5% |
| Australians | 82.5 /100 | #144 | Excellent 11.5% |
| Nigerians | 81.3 /100 | #145 | Excellent 11.5% |
| Immigrants | Hungary | 79.0 /100 | #146 | Good 11.5% |
| Immigrants | Ukraine | 77.6 /100 | #147 | Good 11.5% |