Immigrants from Bosnia and Herzegovina vs Russian Disability
COMPARE
Immigrants from Bosnia and Herzegovina
Russian
Disability
Disability Comparison
Immigrants from Bosnia and Herzegovina
Russians
11.9%
DISABILITY
18.0/ 100
METRIC RATING
193rd/ 347
METRIC RANK
11.5%
DISABILITY
86.8/ 100
METRIC RATING
140th/ 347
METRIC RANK
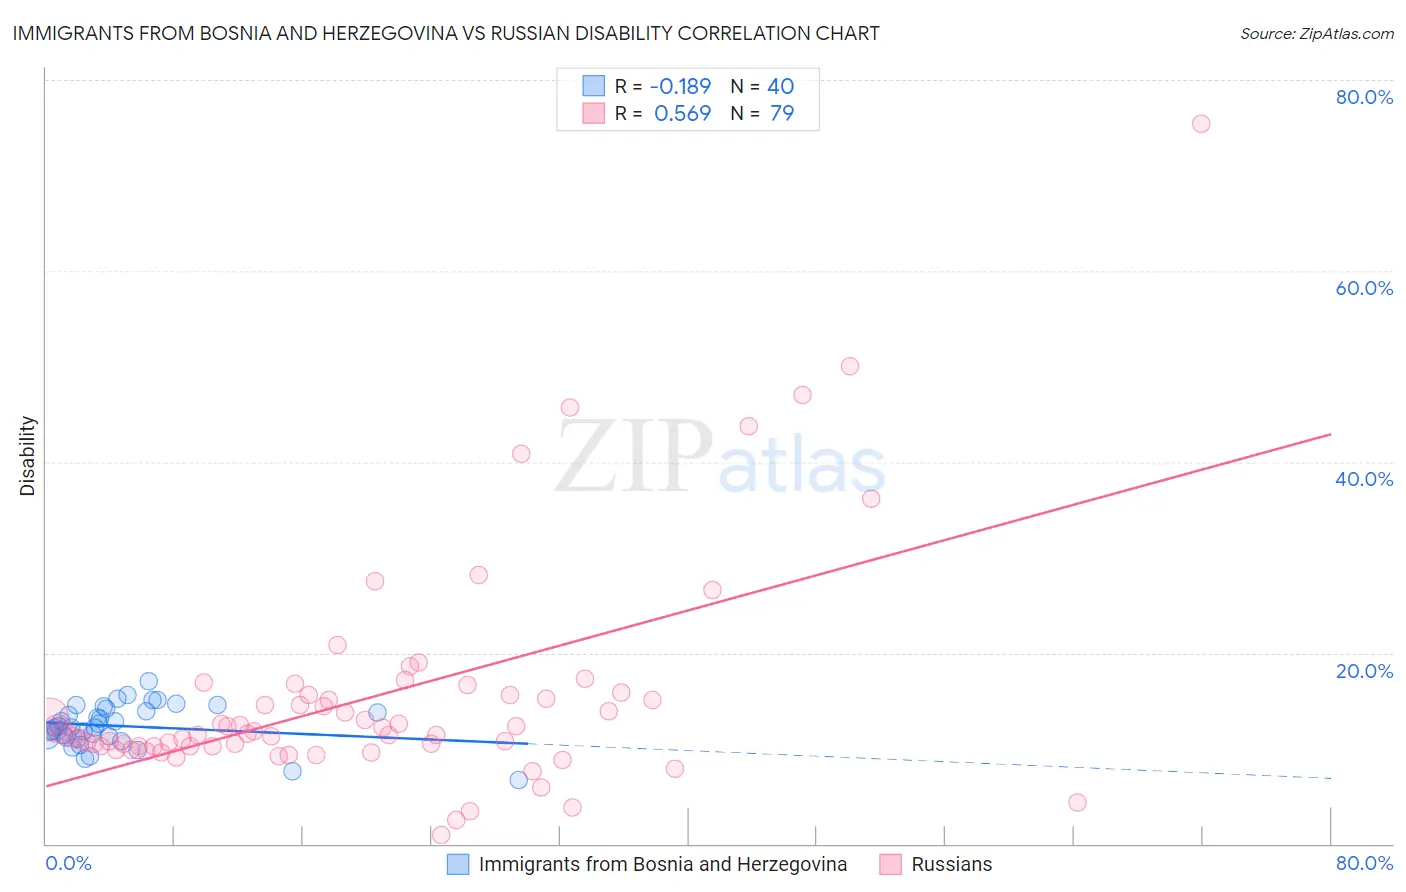
Immigrants from Bosnia and Herzegovina vs Russian Disability Correlation Chart
The statistical analysis conducted on geographies consisting of 156,819,615 people shows a poor negative correlation between the proportion of Immigrants from Bosnia and Herzegovina and percentage of population with a disability in the United States with a correlation coefficient (R) of -0.189 and weighted average of 11.9%. Similarly, the statistical analysis conducted on geographies consisting of 512,171,933 people shows a substantial positive correlation between the proportion of Russians and percentage of population with a disability in the United States with a correlation coefficient (R) of 0.569 and weighted average of 11.5%, a difference of 3.8%.
Disability Correlation Summary
| Measurement | Immigrants from Bosnia and Herzegovina | Russian |
| Minimum | 6.7% | 0.92% |
| Maximum | 17.0% | 75.4% |
| Range | 10.3% | 74.5% |
| Mean | 12.3% | 15.4% |
| Median | 12.2% | 11.6% |
| Interquartile 25% (IQ1) | 11.2% | 10.2% |
| Interquartile 75% (IQ3) | 14.0% | 15.6% |
| Interquartile Range (IQR) | 2.8% | 5.4% |
| Standard Deviation (Sample) | 2.2% | 11.9% |
| Standard Deviation (Population) | 2.2% | 11.8% |
Similar Demographics by Disability
Demographics Similar to Immigrants from Bosnia and Herzegovina by Disability
In terms of disability, the demographic groups most similar to Immigrants from Bosnia and Herzegovina are Lithuanian (11.9%, a difference of 0.050%), Somali (11.9%, a difference of 0.050%), Ute (11.9%, a difference of 0.10%), Barbadian (11.9%, a difference of 0.17%), and Immigrants from West Indies (11.9%, a difference of 0.21%).
| Demographics | Rating | Rank | Disability |
| Immigrants | Scotland | 28.2 /100 | #186 | Fair 11.8% |
| Lebanese | 27.9 /100 | #187 | Fair 11.8% |
| Immigrants | Mexico | 23.8 /100 | #188 | Fair 11.9% |
| Immigrants | Zaire | 21.8 /100 | #189 | Fair 11.9% |
| Immigrants | West Indies | 21.1 /100 | #190 | Fair 11.9% |
| Ute | 19.5 /100 | #191 | Poor 11.9% |
| Lithuanians | 18.8 /100 | #192 | Poor 11.9% |
| Immigrants | Bosnia and Herzegovina | 18.0 /100 | #193 | Poor 11.9% |
| Somalis | 17.3 /100 | #194 | Poor 11.9% |
| Barbadians | 15.8 /100 | #195 | Poor 11.9% |
| Serbians | 15.4 /100 | #196 | Poor 11.9% |
| Immigrants | Belize | 15.2 /100 | #197 | Poor 11.9% |
| Ukrainians | 14.7 /100 | #198 | Poor 11.9% |
| Immigrants | Panama | 14.6 /100 | #199 | Poor 11.9% |
| Belizeans | 12.8 /100 | #200 | Poor 11.9% |
Demographics Similar to Russians by Disability
In terms of disability, the demographic groups most similar to Russians are New Zealander (11.5%, a difference of 0.020%), Ghanaian (11.5%, a difference of 0.020%), Kenyan (11.5%, a difference of 0.030%), Immigrants from Grenada (11.5%, a difference of 0.070%), and Immigrants from St. Vincent and the Grenadines (11.4%, a difference of 0.10%).
| Demographics | Rating | Rank | Disability |
| Arabs | 89.1 /100 | #133 | Excellent 11.4% |
| Immigrants | Guyana | 88.3 /100 | #134 | Excellent 11.4% |
| Ugandans | 87.9 /100 | #135 | Excellent 11.4% |
| Immigrants | St. Vincent and the Grenadines | 87.8 /100 | #136 | Excellent 11.4% |
| Kenyans | 87.1 /100 | #137 | Excellent 11.5% |
| New Zealanders | 87.0 /100 | #138 | Excellent 11.5% |
| Ghanaians | 87.0 /100 | #139 | Excellent 11.5% |
| Russians | 86.8 /100 | #140 | Excellent 11.5% |
| Immigrants | Grenada | 86.1 /100 | #141 | Excellent 11.5% |
| Immigrants | Sudan | 85.3 /100 | #142 | Excellent 11.5% |
| Moroccans | 83.3 /100 | #143 | Excellent 11.5% |
| Australians | 82.5 /100 | #144 | Excellent 11.5% |
| Nigerians | 81.3 /100 | #145 | Excellent 11.5% |
| Immigrants | Hungary | 79.0 /100 | #146 | Good 11.5% |
| Immigrants | Ukraine | 77.6 /100 | #147 | Good 11.5% |