Alsatian vs Russian Disability
COMPARE
Alsatian
Russian
Disability
Disability Comparison
Alsatians
Russians
12.1%
DISABILITY
3.3/ 100
METRIC RATING
227th/ 347
METRIC RANK
11.5%
DISABILITY
86.8/ 100
METRIC RATING
140th/ 347
METRIC RANK
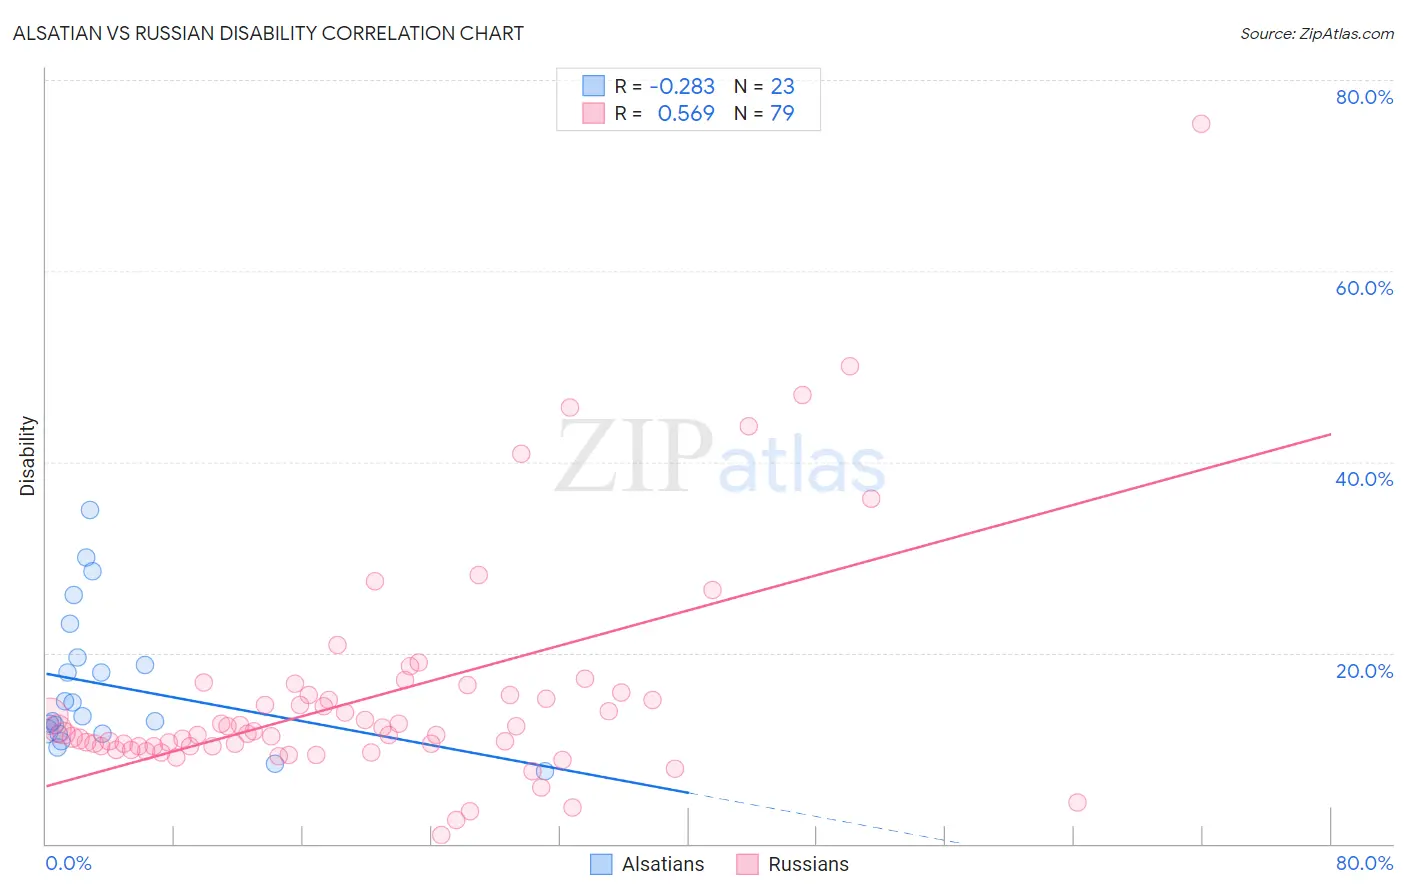
Alsatian vs Russian Disability Correlation Chart
The statistical analysis conducted on geographies consisting of 82,681,540 people shows a weak negative correlation between the proportion of Alsatians and percentage of population with a disability in the United States with a correlation coefficient (R) of -0.283 and weighted average of 12.1%. Similarly, the statistical analysis conducted on geographies consisting of 512,171,933 people shows a substantial positive correlation between the proportion of Russians and percentage of population with a disability in the United States with a correlation coefficient (R) of 0.569 and weighted average of 11.5%, a difference of 6.0%.
Disability Correlation Summary
| Measurement | Alsatian | Russian |
| Minimum | 7.5% | 0.92% |
| Maximum | 34.9% | 75.4% |
| Range | 27.4% | 74.5% |
| Mean | 16.6% | 15.4% |
| Median | 13.4% | 11.6% |
| Interquartile 25% (IQ1) | 11.5% | 10.2% |
| Interquartile 75% (IQ3) | 19.6% | 15.6% |
| Interquartile Range (IQR) | 8.0% | 5.4% |
| Standard Deviation (Sample) | 7.3% | 11.9% |
| Standard Deviation (Population) | 7.2% | 11.8% |
Similar Demographics by Disability
Demographics Similar to Alsatians by Disability
In terms of disability, the demographic groups most similar to Alsatians are Jamaican (12.1%, a difference of 0.010%), Senegalese (12.1%, a difference of 0.060%), Mexican (12.1%, a difference of 0.14%), West Indian (12.2%, a difference of 0.14%), and Inupiat (12.2%, a difference of 0.16%).
| Demographics | Rating | Rank | Disability |
| Immigrants | Bahamas | 4.7 /100 | #220 | Tragic 12.1% |
| Northern Europeans | 4.2 /100 | #221 | Tragic 12.1% |
| Spanish American Indians | 4.1 /100 | #222 | Tragic 12.1% |
| Hispanics or Latinos | 3.9 /100 | #223 | Tragic 12.1% |
| Mexicans | 3.7 /100 | #224 | Tragic 12.1% |
| Senegalese | 3.5 /100 | #225 | Tragic 12.1% |
| Jamaicans | 3.3 /100 | #226 | Tragic 12.1% |
| Alsatians | 3.3 /100 | #227 | Tragic 12.1% |
| West Indians | 2.9 /100 | #228 | Tragic 12.2% |
| Inupiat | 2.8 /100 | #229 | Tragic 12.2% |
| Samoans | 2.6 /100 | #230 | Tragic 12.2% |
| Malaysians | 2.5 /100 | #231 | Tragic 12.2% |
| Italians | 2.5 /100 | #232 | Tragic 12.2% |
| Bahamians | 2.3 /100 | #233 | Tragic 12.2% |
| Japanese | 2.3 /100 | #234 | Tragic 12.2% |
Demographics Similar to Russians by Disability
In terms of disability, the demographic groups most similar to Russians are New Zealander (11.5%, a difference of 0.020%), Ghanaian (11.5%, a difference of 0.020%), Kenyan (11.5%, a difference of 0.030%), Immigrants from Grenada (11.5%, a difference of 0.070%), and Immigrants from St. Vincent and the Grenadines (11.4%, a difference of 0.10%).
| Demographics | Rating | Rank | Disability |
| Arabs | 89.1 /100 | #133 | Excellent 11.4% |
| Immigrants | Guyana | 88.3 /100 | #134 | Excellent 11.4% |
| Ugandans | 87.9 /100 | #135 | Excellent 11.4% |
| Immigrants | St. Vincent and the Grenadines | 87.8 /100 | #136 | Excellent 11.4% |
| Kenyans | 87.1 /100 | #137 | Excellent 11.5% |
| New Zealanders | 87.0 /100 | #138 | Excellent 11.5% |
| Ghanaians | 87.0 /100 | #139 | Excellent 11.5% |
| Russians | 86.8 /100 | #140 | Excellent 11.5% |
| Immigrants | Grenada | 86.1 /100 | #141 | Excellent 11.5% |
| Immigrants | Sudan | 85.3 /100 | #142 | Excellent 11.5% |
| Moroccans | 83.3 /100 | #143 | Excellent 11.5% |
| Australians | 82.5 /100 | #144 | Excellent 11.5% |
| Nigerians | 81.3 /100 | #145 | Excellent 11.5% |
| Immigrants | Hungary | 79.0 /100 | #146 | Good 11.5% |
| Immigrants | Ukraine | 77.6 /100 | #147 | Good 11.5% |