Sioux vs Ottawa In Labor Force | Age > 16
COMPARE
Sioux
Ottawa
In Labor Force | Age > 16
In Labor Force | Age > 16 Comparison
Sioux
Ottawa
61.8%
IN LABOR FORCE | AGE > 16
0.0/ 100
METRIC RATING
326th/ 347
METRIC RANK
62.0%
IN LABOR FORCE | AGE > 16
0.0/ 100
METRIC RATING
322nd/ 347
METRIC RANK
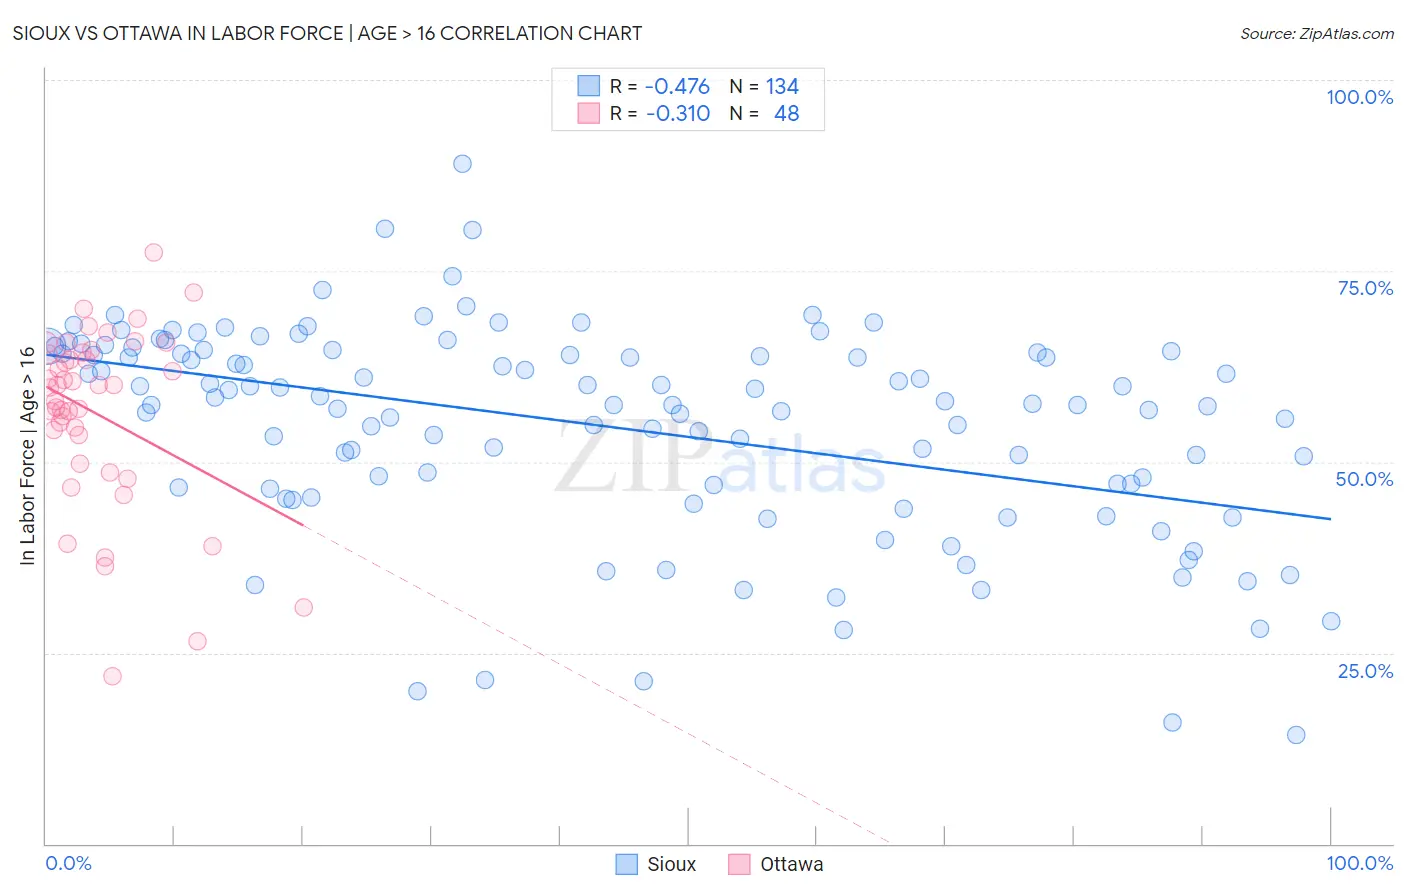
Sioux vs Ottawa In Labor Force | Age > 16 Correlation Chart
The statistical analysis conducted on geographies consisting of 234,180,906 people shows a moderate negative correlation between the proportion of Sioux and labor force participation rate among population ages 16 and over in the United States with a correlation coefficient (R) of -0.476 and weighted average of 61.8%. Similarly, the statistical analysis conducted on geographies consisting of 49,955,399 people shows a mild negative correlation between the proportion of Ottawa and labor force participation rate among population ages 16 and over in the United States with a correlation coefficient (R) of -0.310 and weighted average of 62.0%, a difference of 0.29%.
In Labor Force | Age > 16 Correlation Summary
| Measurement | Sioux | Ottawa |
| Minimum | 14.3% | 21.9% |
| Maximum | 89.1% | 77.4% |
| Range | 74.8% | 55.5% |
| Mean | 54.7% | 56.2% |
| Median | 57.6% | 59.9% |
| Interquartile 25% (IQ1) | 46.6% | 51.7% |
| Interquartile 75% (IQ3) | 64.3% | 64.2% |
| Interquartile Range (IQR) | 17.7% | 12.5% |
| Standard Deviation (Sample) | 13.6% | 11.9% |
| Standard Deviation (Population) | 13.6% | 11.7% |
Demographics Similar to Sioux and Ottawa by In Labor Force | Age > 16
In terms of in labor force | age > 16, the demographic groups most similar to Sioux are Cajun (61.8%, a difference of 0.11%), Cherokee (61.9%, a difference of 0.17%), Cheyenne (62.0%, a difference of 0.22%), Seminole (62.0%, a difference of 0.26%), and Dutch West Indian (61.7%, a difference of 0.27%). Similarly, the demographic groups most similar to Ottawa are Seminole (62.0%, a difference of 0.030%), Cheyenne (62.0%, a difference of 0.070%), Cherokee (61.9%, a difference of 0.11%), American (62.1%, a difference of 0.16%), and Yakama (62.1%, a difference of 0.19%).
| Demographics | Rating | Rank | In Labor Force | Age > 16 |
| Yaqui | 0.0 /100 | #314 | Tragic 63.0% |
| Potawatomi | 0.0 /100 | #315 | Tragic 62.8% |
| Yup'ik | 0.0 /100 | #316 | Tragic 62.7% |
| Kiowa | 0.0 /100 | #317 | Tragic 62.4% |
| Chickasaw | 0.0 /100 | #318 | Tragic 62.3% |
| Arapaho | 0.0 /100 | #319 | Tragic 62.1% |
| Yakama | 0.0 /100 | #320 | Tragic 62.1% |
| Americans | 0.0 /100 | #321 | Tragic 62.1% |
| Ottawa | 0.0 /100 | #322 | Tragic 62.0% |
| Seminole | 0.0 /100 | #323 | Tragic 62.0% |
| Cheyenne | 0.0 /100 | #324 | Tragic 62.0% |
| Cherokee | 0.0 /100 | #325 | Tragic 61.9% |
| Sioux | 0.0 /100 | #326 | Tragic 61.8% |
| Cajuns | 0.0 /100 | #327 | Tragic 61.8% |
| Dutch West Indians | 0.0 /100 | #328 | Tragic 61.7% |
| Choctaw | 0.0 /100 | #329 | Tragic 61.5% |
| Creek | 0.0 /100 | #330 | Tragic 61.3% |
| Ute | 0.0 /100 | #331 | Tragic 60.9% |
| Crow | 0.0 /100 | #332 | Tragic 60.8% |
| Paiute | 0.0 /100 | #333 | Tragic 60.7% |
| Apache | 0.0 /100 | #334 | Tragic 60.7% |