Sioux vs Ottawa Median Household Income
COMPARE
Sioux
Ottawa
Median Household Income
Median Household Income Comparison
Sioux
Ottawa
$67,792
MEDIAN HOUSEHOLD INCOME
0.0/ 100
METRIC RATING
332nd/ 347
METRIC RANK
$70,984
MEDIAN HOUSEHOLD INCOME
0.0/ 100
METRIC RATING
315th/ 347
METRIC RANK
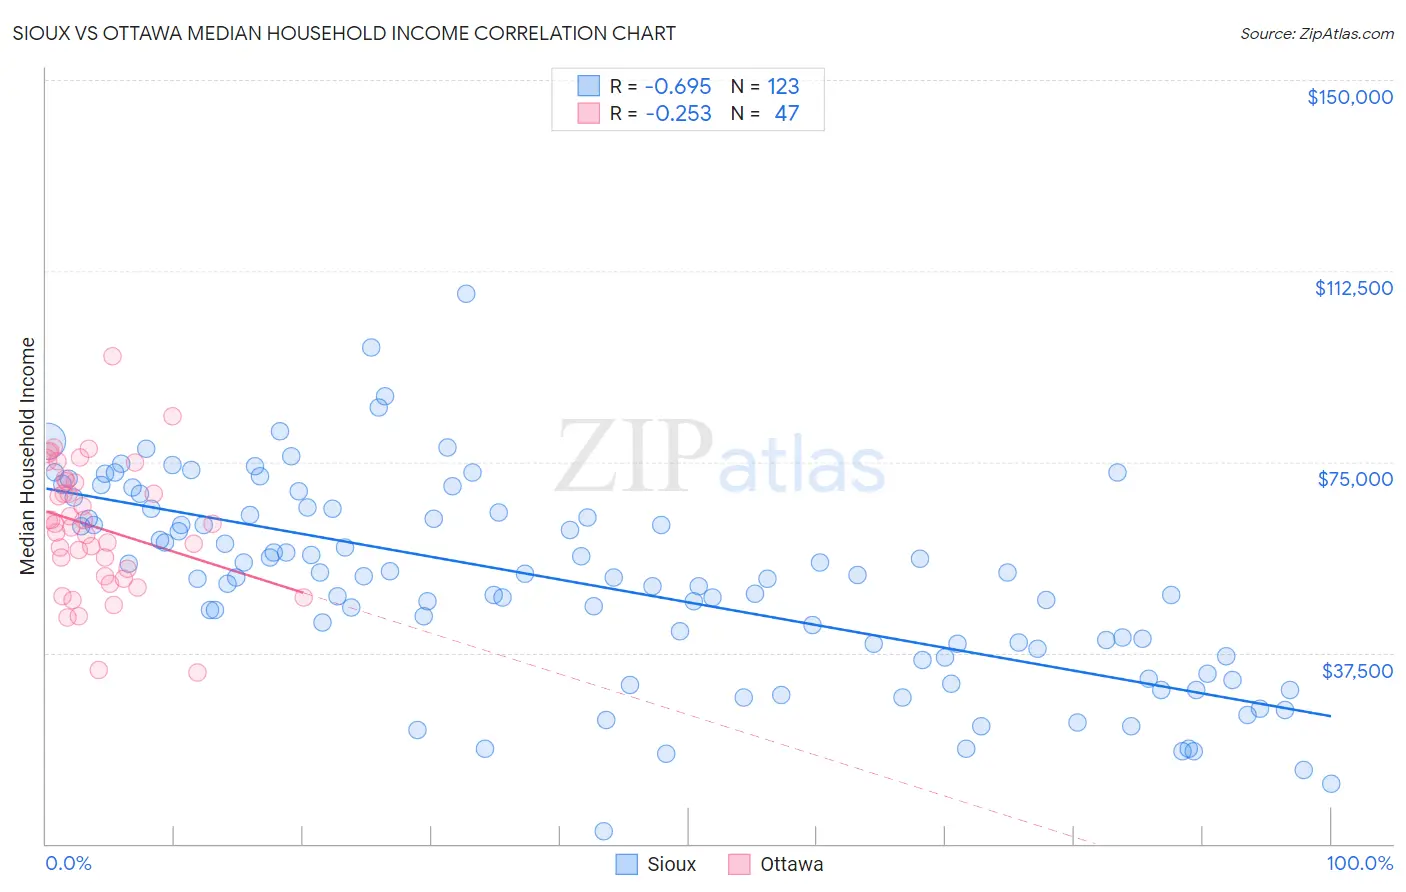
Sioux vs Ottawa Median Household Income Correlation Chart
The statistical analysis conducted on geographies consisting of 234,052,794 people shows a significant negative correlation between the proportion of Sioux and median household income in the United States with a correlation coefficient (R) of -0.695 and weighted average of $67,792. Similarly, the statistical analysis conducted on geographies consisting of 49,944,469 people shows a weak negative correlation between the proportion of Ottawa and median household income in the United States with a correlation coefficient (R) of -0.253 and weighted average of $70,984, a difference of 4.7%.
Median Household Income Correlation Summary
| Measurement | Sioux | Ottawa |
| Minimum | $2,499 | $33,750 |
| Maximum | $108,000 | $95,750 |
| Range | $105,501 | $62,000 |
| Mean | $51,141 | $62,197 |
| Median | $52,399 | $62,810 |
| Interquartile 25% (IQ1) | $36,923 | $52,443 |
| Interquartile 75% (IQ3) | $65,000 | $71,315 |
| Interquartile Range (IQR) | $28,077 | $18,872 |
| Standard Deviation (Sample) | $19,497 | $12,658 |
| Standard Deviation (Population) | $19,417 | $12,523 |
Demographics Similar to Sioux and Ottawa by Median Household Income
In terms of median household income, the demographic groups most similar to Sioux are Creek ($67,715, a difference of 0.11%), Native/Alaskan ($67,879, a difference of 0.13%), Arapaho ($67,965, a difference of 0.25%), Dutch West Indian ($68,412, a difference of 0.91%), and Menominee ($68,423, a difference of 0.93%). Similarly, the demographic groups most similar to Ottawa are Apache ($70,927, a difference of 0.080%), Dominican ($71,302, a difference of 0.45%), Immigrants from Bahamas ($71,349, a difference of 0.51%), Cajun ($70,605, a difference of 0.54%), and Chippewa ($70,539, a difference of 0.63%).
| Demographics | Rating | Rank | Median Household Income |
| Immigrants | Bahamas | 0.0 /100 | #313 | Tragic $71,349 |
| Dominicans | 0.0 /100 | #314 | Tragic $71,302 |
| Ottawa | 0.0 /100 | #315 | Tragic $70,984 |
| Apache | 0.0 /100 | #316 | Tragic $70,927 |
| Cajuns | 0.0 /100 | #317 | Tragic $70,605 |
| Chippewa | 0.0 /100 | #318 | Tragic $70,539 |
| Immigrants | Dominican Republic | 0.0 /100 | #319 | Tragic $70,208 |
| Colville | 0.0 /100 | #320 | Tragic $70,094 |
| Chickasaw | 0.0 /100 | #321 | Tragic $70,005 |
| Choctaw | 0.0 /100 | #322 | Tragic $69,947 |
| Bahamians | 0.0 /100 | #323 | Tragic $69,726 |
| Yup'ik | 0.0 /100 | #324 | Tragic $69,695 |
| Seminole | 0.0 /100 | #325 | Tragic $69,420 |
| Yuman | 0.0 /100 | #326 | Tragic $68,743 |
| Immigrants | Cuba | 0.0 /100 | #327 | Tragic $68,461 |
| Menominee | 0.0 /100 | #328 | Tragic $68,423 |
| Dutch West Indians | 0.0 /100 | #329 | Tragic $68,412 |
| Arapaho | 0.0 /100 | #330 | Tragic $67,965 |
| Natives/Alaskans | 0.0 /100 | #331 | Tragic $67,879 |
| Sioux | 0.0 /100 | #332 | Tragic $67,792 |
| Creek | 0.0 /100 | #333 | Tragic $67,715 |