Sioux vs Immigrants from Afghanistan Disability Age 5 to 17
COMPARE
Sioux
Immigrants from Afghanistan
Disability Age 5 to 17
Disability Age 5 to 17 Comparison
Sioux
Immigrants from Afghanistan
6.0%
DISABILITY AGE 5 TO 17
0.4/ 100
METRIC RATING
268th/ 347
METRIC RANK
5.3%
DISABILITY AGE 5 TO 17
97.4/ 100
METRIC RATING
117th/ 347
METRIC RANK
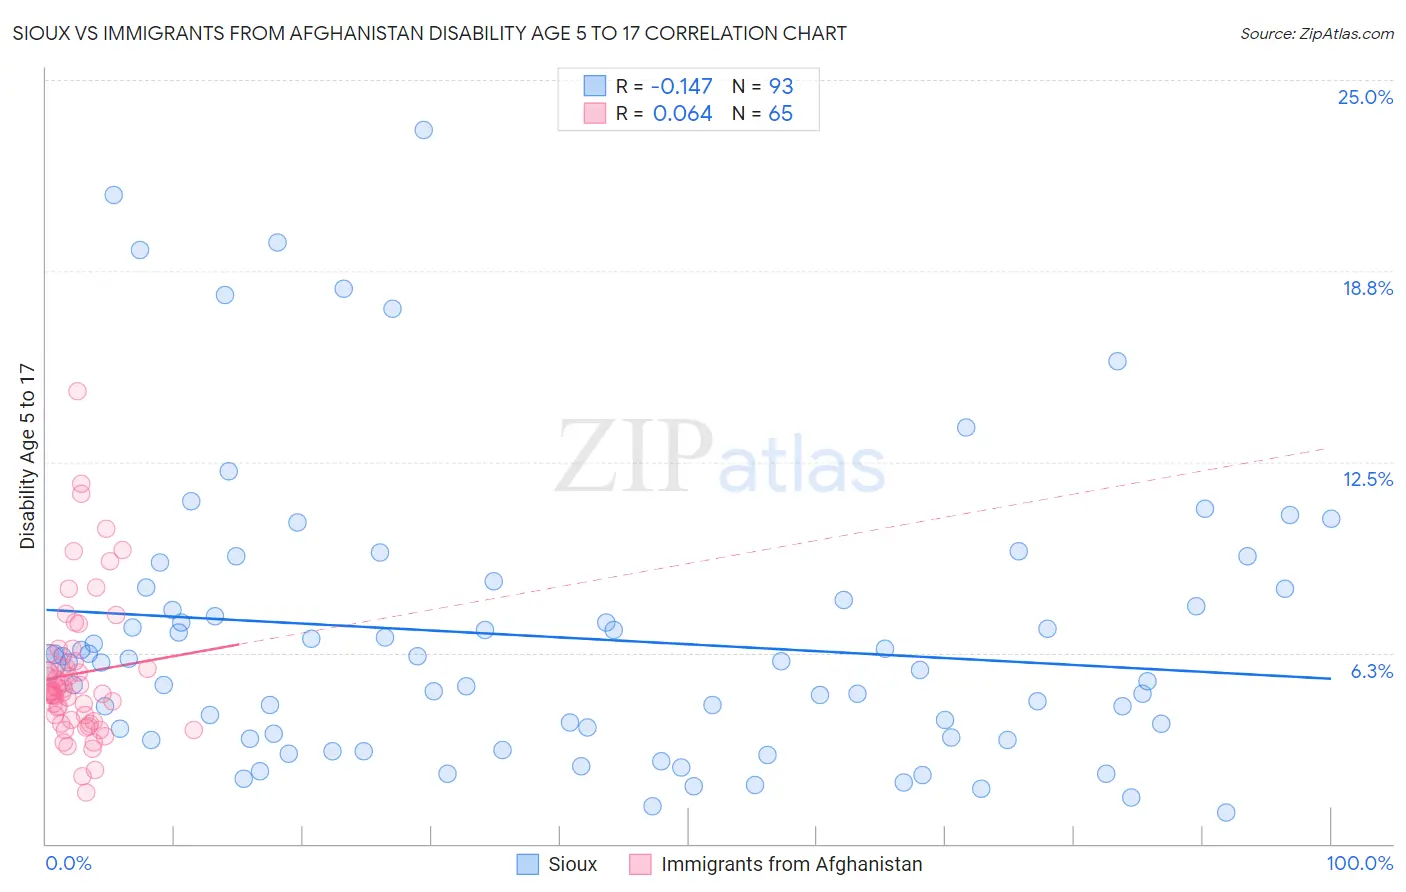
Sioux vs Immigrants from Afghanistan Disability Age 5 to 17 Correlation Chart
The statistical analysis conducted on geographies consisting of 232,872,632 people shows a poor negative correlation between the proportion of Sioux and percentage of population with a disability between the ages 5 and 17 in the United States with a correlation coefficient (R) of -0.147 and weighted average of 6.0%. Similarly, the statistical analysis conducted on geographies consisting of 147,197,309 people shows a slight positive correlation between the proportion of Immigrants from Afghanistan and percentage of population with a disability between the ages 5 and 17 in the United States with a correlation coefficient (R) of 0.064 and weighted average of 5.3%, a difference of 11.7%.
Disability Age 5 to 17 Correlation Summary
| Measurement | Sioux | Immigrants from Afghanistan |
| Minimum | 1.0% | 1.7% |
| Maximum | 23.4% | 14.8% |
| Range | 22.4% | 13.1% |
| Mean | 6.8% | 5.6% |
| Median | 5.9% | 5.0% |
| Interquartile 25% (IQ1) | 3.5% | 4.0% |
| Interquartile 75% (IQ3) | 8.2% | 6.1% |
| Interquartile Range (IQR) | 4.7% | 2.1% |
| Standard Deviation (Sample) | 4.7% | 2.4% |
| Standard Deviation (Population) | 4.7% | 2.4% |
Similar Demographics by Disability Age 5 to 17
Demographics Similar to Sioux by Disability Age 5 to 17
In terms of disability age 5 to 17, the demographic groups most similar to Sioux are Liberian (6.0%, a difference of 0.030%), Spanish (6.0%, a difference of 0.19%), Immigrants from Somalia (6.0%, a difference of 0.22%), Slovene (6.0%, a difference of 0.30%), and Panamanian (6.0%, a difference of 0.33%).
| Demographics | Rating | Rank | Disability Age 5 to 17 |
| Immigrants | Middle Africa | 0.7 /100 | #261 | Tragic 5.9% |
| Immigrants | Western Africa | 0.7 /100 | #262 | Tragic 5.9% |
| Czechoslovakians | 0.7 /100 | #263 | Tragic 5.9% |
| Canadians | 0.6 /100 | #264 | Tragic 6.0% |
| Panamanians | 0.6 /100 | #265 | Tragic 6.0% |
| Slovenes | 0.6 /100 | #266 | Tragic 6.0% |
| Spanish | 0.5 /100 | #267 | Tragic 6.0% |
| Sioux | 0.4 /100 | #268 | Tragic 6.0% |
| Liberians | 0.4 /100 | #269 | Tragic 6.0% |
| Immigrants | Somalia | 0.4 /100 | #270 | Tragic 6.0% |
| Immigrants | Zaire | 0.2 /100 | #271 | Tragic 6.0% |
| Finns | 0.2 /100 | #272 | Tragic 6.0% |
| Alaska Natives | 0.2 /100 | #273 | Tragic 6.0% |
| Cheyenne | 0.2 /100 | #274 | Tragic 6.0% |
| Dutch | 0.2 /100 | #275 | Tragic 6.0% |
Demographics Similar to Immigrants from Afghanistan by Disability Age 5 to 17
In terms of disability age 5 to 17, the demographic groups most similar to Immigrants from Afghanistan are South American (5.4%, a difference of 0.11%), Immigrants from South America (5.4%, a difference of 0.11%), Cypriot (5.3%, a difference of 0.16%), Immigrants (5.4%, a difference of 0.17%), and Cuban (5.3%, a difference of 0.23%).
| Demographics | Rating | Rank | Disability Age 5 to 17 |
| Immigrants | Eritrea | 98.0 /100 | #110 | Exceptional 5.3% |
| Ethiopians | 97.9 /100 | #111 | Exceptional 5.3% |
| Immigrants | Latvia | 97.9 /100 | #112 | Exceptional 5.3% |
| Aleuts | 97.8 /100 | #113 | Exceptional 5.3% |
| Immigrants | Northern Europe | 97.8 /100 | #114 | Exceptional 5.3% |
| Cubans | 97.8 /100 | #115 | Exceptional 5.3% |
| Cypriots | 97.7 /100 | #116 | Exceptional 5.3% |
| Immigrants | Afghanistan | 97.4 /100 | #117 | Exceptional 5.3% |
| South Americans | 97.1 /100 | #118 | Exceptional 5.4% |
| Immigrants | South America | 97.1 /100 | #119 | Exceptional 5.4% |
| Immigrants | Immigrants | 97.0 /100 | #120 | Exceptional 5.4% |
| Maltese | 96.0 /100 | #121 | Exceptional 5.4% |
| Chileans | 95.8 /100 | #122 | Exceptional 5.4% |
| Immigrants | Ethiopia | 95.5 /100 | #123 | Exceptional 5.4% |
| Crow | 95.0 /100 | #124 | Exceptional 5.4% |