Shoshone vs Swiss Ambulatory Disability
COMPARE
Shoshone
Swiss
Ambulatory Disability
Ambulatory Disability Comparison
Shoshone
Swiss
7.1%
AMBULATORY DISABILITY
0.0/ 100
METRIC RATING
315th/ 347
METRIC RANK
6.1%
AMBULATORY DISABILITY
43.1/ 100
METRIC RATING
181st/ 347
METRIC RANK
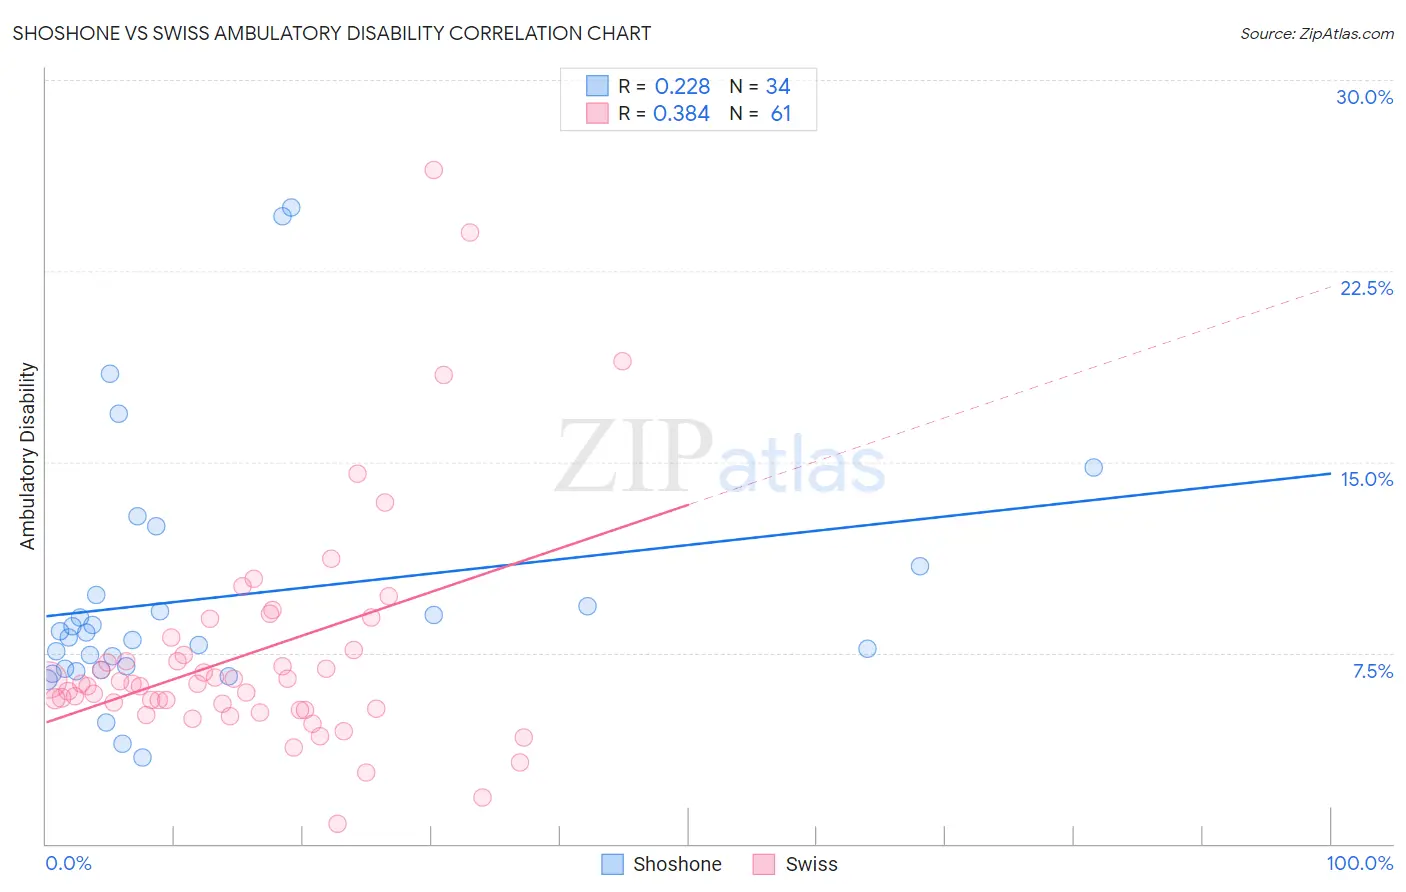
Shoshone vs Swiss Ambulatory Disability Correlation Chart
The statistical analysis conducted on geographies consisting of 66,618,747 people shows a weak positive correlation between the proportion of Shoshone and percentage of population with ambulatory disability in the United States with a correlation coefficient (R) of 0.228 and weighted average of 7.1%. Similarly, the statistical analysis conducted on geographies consisting of 464,822,088 people shows a mild positive correlation between the proportion of Swiss and percentage of population with ambulatory disability in the United States with a correlation coefficient (R) of 0.384 and weighted average of 6.1%, a difference of 16.2%.
Ambulatory Disability Correlation Summary
| Measurement | Shoshone | Swiss |
| Minimum | 3.4% | 0.81% |
| Maximum | 25.0% | 26.5% |
| Range | 21.6% | 25.7% |
| Mean | 9.7% | 7.5% |
| Median | 8.2% | 6.3% |
| Interquartile 25% (IQ1) | 6.9% | 5.3% |
| Interquartile 75% (IQ3) | 9.8% | 7.8% |
| Interquartile Range (IQR) | 2.9% | 2.6% |
| Standard Deviation (Sample) | 5.0% | 4.6% |
| Standard Deviation (Population) | 4.9% | 4.6% |
Similar Demographics by Ambulatory Disability
Demographics Similar to Shoshone by Ambulatory Disability
In terms of ambulatory disability, the demographic groups most similar to Shoshone are Blackfeet (7.1%, a difference of 0.020%), Immigrants from Yemen (7.1%, a difference of 0.040%), Delaware (7.1%, a difference of 0.17%), Immigrants from Dominican Republic (7.1%, a difference of 0.24%), and Central American Indian (7.2%, a difference of 0.32%).
| Demographics | Rating | Rank | Ambulatory Disability |
| Chippewa | 0.0 /100 | #308 | Tragic 7.1% |
| Immigrants | Azores | 0.0 /100 | #309 | Tragic 7.1% |
| Arapaho | 0.0 /100 | #310 | Tragic 7.1% |
| Cree | 0.0 /100 | #311 | Tragic 7.1% |
| Delaware | 0.0 /100 | #312 | Tragic 7.1% |
| Immigrants | Yemen | 0.0 /100 | #313 | Tragic 7.1% |
| Blackfeet | 0.0 /100 | #314 | Tragic 7.1% |
| Shoshone | 0.0 /100 | #315 | Tragic 7.1% |
| Immigrants | Dominican Republic | 0.0 /100 | #316 | Tragic 7.1% |
| Central American Indians | 0.0 /100 | #317 | Tragic 7.2% |
| Ottawa | 0.0 /100 | #318 | Tragic 7.2% |
| Dominicans | 0.0 /100 | #319 | Tragic 7.2% |
| Potawatomi | 0.0 /100 | #320 | Tragic 7.3% |
| Apache | 0.0 /100 | #321 | Tragic 7.4% |
| Osage | 0.0 /100 | #322 | Tragic 7.4% |
Demographics Similar to Swiss by Ambulatory Disability
In terms of ambulatory disability, the demographic groups most similar to Swiss are Serbian (6.1%, a difference of 0.010%), Immigrants from Nicaragua (6.1%, a difference of 0.040%), Austrian (6.1%, a difference of 0.050%), Immigrants from Thailand (6.1%, a difference of 0.050%), and Scandinavian (6.1%, a difference of 0.080%).
| Demographics | Rating | Rank | Ambulatory Disability |
| Immigrants | Canada | 50.0 /100 | #174 | Average 6.1% |
| Vietnamese | 47.2 /100 | #175 | Average 6.1% |
| Immigrants | North America | 45.6 /100 | #176 | Average 6.1% |
| Immigrants | England | 45.4 /100 | #177 | Average 6.1% |
| Scandinavians | 44.5 /100 | #178 | Average 6.1% |
| Austrians | 44.1 /100 | #179 | Average 6.1% |
| Immigrants | Nicaragua | 43.9 /100 | #180 | Average 6.1% |
| Swiss | 43.1 /100 | #181 | Average 6.1% |
| Serbians | 42.8 /100 | #182 | Average 6.1% |
| Immigrants | Thailand | 42.2 /100 | #183 | Average 6.1% |
| Immigrants | Ghana | 41.2 /100 | #184 | Average 6.1% |
| Immigrants | Bosnia and Herzegovina | 37.2 /100 | #185 | Fair 6.2% |
| Europeans | 36.2 /100 | #186 | Fair 6.2% |
| Carpatho Rusyns | 35.3 /100 | #187 | Fair 6.2% |
| British | 34.3 /100 | #188 | Fair 6.2% |