Shoshone vs Jordanian Ambulatory Disability
COMPARE
Shoshone
Jordanian
Ambulatory Disability
Ambulatory Disability Comparison
Shoshone
Jordanians
7.1%
AMBULATORY DISABILITY
0.0/ 100
METRIC RATING
315th/ 347
METRIC RANK
5.6%
AMBULATORY DISABILITY
99.8/ 100
METRIC RATING
52nd/ 347
METRIC RANK
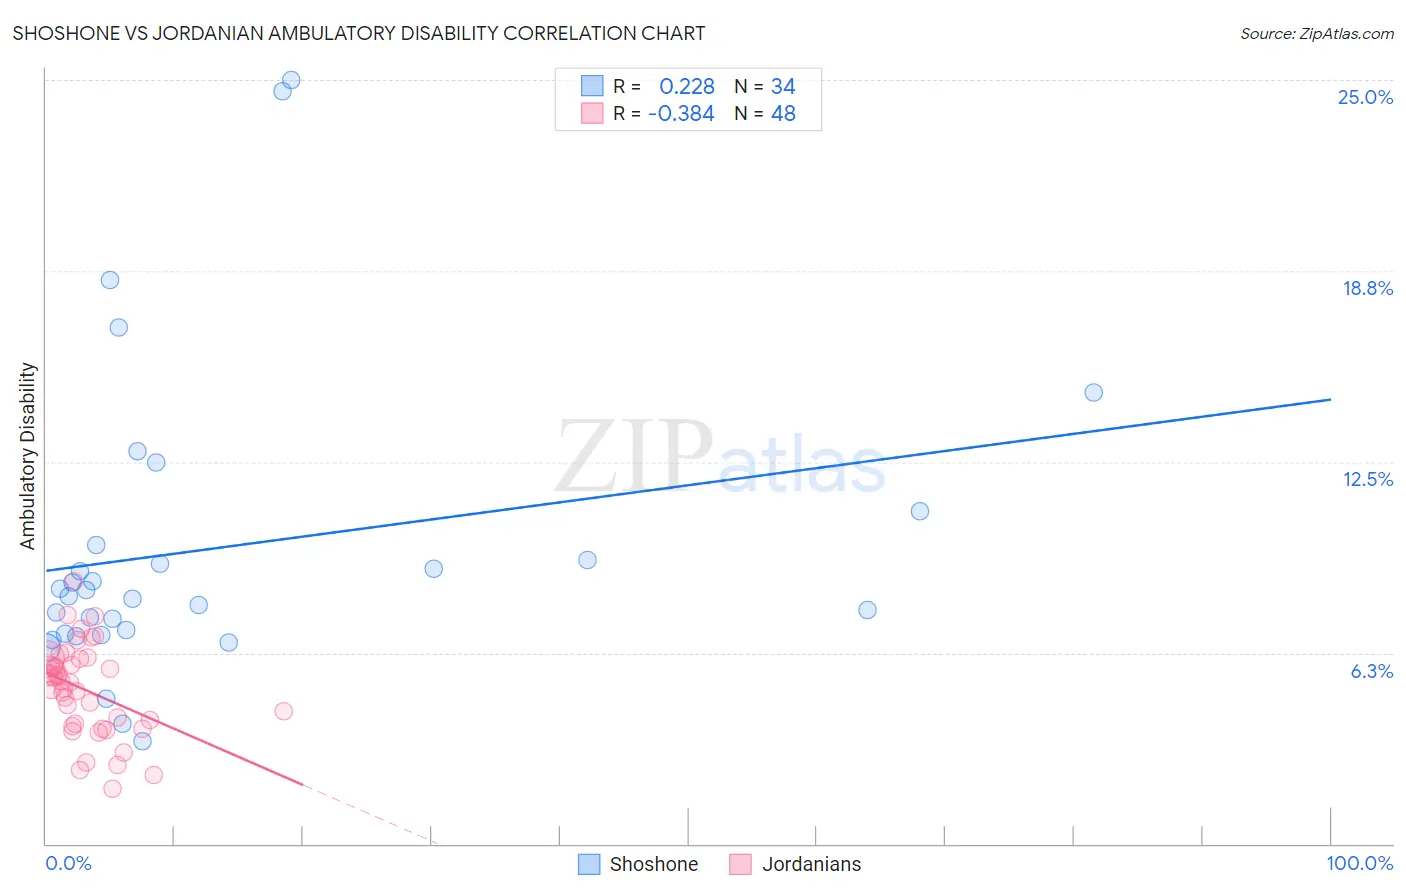
Shoshone vs Jordanian Ambulatory Disability Correlation Chart
The statistical analysis conducted on geographies consisting of 66,618,747 people shows a weak positive correlation between the proportion of Shoshone and percentage of population with ambulatory disability in the United States with a correlation coefficient (R) of 0.228 and weighted average of 7.1%. Similarly, the statistical analysis conducted on geographies consisting of 166,412,494 people shows a mild negative correlation between the proportion of Jordanians and percentage of population with ambulatory disability in the United States with a correlation coefficient (R) of -0.384 and weighted average of 5.6%, a difference of 27.4%.
Ambulatory Disability Correlation Summary
| Measurement | Shoshone | Jordanian |
| Minimum | 3.4% | 1.8% |
| Maximum | 25.0% | 8.6% |
| Range | 21.6% | 6.8% |
| Mean | 9.7% | 5.0% |
| Median | 8.2% | 5.3% |
| Interquartile 25% (IQ1) | 6.9% | 3.9% |
| Interquartile 75% (IQ3) | 9.8% | 5.9% |
| Interquartile Range (IQR) | 2.9% | 2.1% |
| Standard Deviation (Sample) | 5.0% | 1.5% |
| Standard Deviation (Population) | 4.9% | 1.5% |
Similar Demographics by Ambulatory Disability
Demographics Similar to Shoshone by Ambulatory Disability
In terms of ambulatory disability, the demographic groups most similar to Shoshone are Blackfeet (7.1%, a difference of 0.020%), Immigrants from Yemen (7.1%, a difference of 0.040%), Delaware (7.1%, a difference of 0.17%), Immigrants from Dominican Republic (7.1%, a difference of 0.24%), and Central American Indian (7.2%, a difference of 0.32%).
| Demographics | Rating | Rank | Ambulatory Disability |
| Chippewa | 0.0 /100 | #308 | Tragic 7.1% |
| Immigrants | Azores | 0.0 /100 | #309 | Tragic 7.1% |
| Arapaho | 0.0 /100 | #310 | Tragic 7.1% |
| Cree | 0.0 /100 | #311 | Tragic 7.1% |
| Delaware | 0.0 /100 | #312 | Tragic 7.1% |
| Immigrants | Yemen | 0.0 /100 | #313 | Tragic 7.1% |
| Blackfeet | 0.0 /100 | #314 | Tragic 7.1% |
| Shoshone | 0.0 /100 | #315 | Tragic 7.1% |
| Immigrants | Dominican Republic | 0.0 /100 | #316 | Tragic 7.1% |
| Central American Indians | 0.0 /100 | #317 | Tragic 7.2% |
| Ottawa | 0.0 /100 | #318 | Tragic 7.2% |
| Dominicans | 0.0 /100 | #319 | Tragic 7.2% |
| Potawatomi | 0.0 /100 | #320 | Tragic 7.3% |
| Apache | 0.0 /100 | #321 | Tragic 7.4% |
| Osage | 0.0 /100 | #322 | Tragic 7.4% |
Demographics Similar to Jordanians by Ambulatory Disability
In terms of ambulatory disability, the demographic groups most similar to Jordanians are Immigrants from Egypt (5.6%, a difference of 0.010%), Immigrants from Eastern Africa (5.6%, a difference of 0.060%), Taiwanese (5.6%, a difference of 0.090%), Immigrants from Bulgaria (5.6%, a difference of 0.12%), and Luxembourger (5.6%, a difference of 0.19%).
| Demographics | Rating | Rank | Ambulatory Disability |
| Immigrants | Sweden | 99.9 /100 | #45 | Exceptional 5.6% |
| Egyptians | 99.9 /100 | #46 | Exceptional 5.6% |
| Immigrants | Japan | 99.9 /100 | #47 | Exceptional 5.6% |
| Immigrants | Argentina | 99.9 /100 | #48 | Exceptional 5.6% |
| Bulgarians | 99.9 /100 | #49 | Exceptional 5.6% |
| Luxembourgers | 99.9 /100 | #50 | Exceptional 5.6% |
| Taiwanese | 99.8 /100 | #51 | Exceptional 5.6% |
| Jordanians | 99.8 /100 | #52 | Exceptional 5.6% |
| Immigrants | Egypt | 99.8 /100 | #53 | Exceptional 5.6% |
| Immigrants | Eastern Africa | 99.8 /100 | #54 | Exceptional 5.6% |
| Immigrants | Bulgaria | 99.8 /100 | #55 | Exceptional 5.6% |
| Inupiat | 99.8 /100 | #56 | Exceptional 5.6% |
| Immigrants | Brazil | 99.8 /100 | #57 | Exceptional 5.6% |
| Immigrants | Zimbabwe | 99.8 /100 | #58 | Exceptional 5.6% |
| Immigrants | Afghanistan | 99.8 /100 | #59 | Exceptional 5.6% |