Slovak vs Swiss Ambulatory Disability
COMPARE
Slovak
Swiss
Ambulatory Disability
Ambulatory Disability Comparison
Slovaks
Swiss
6.7%
AMBULATORY DISABILITY
0.1/ 100
METRIC RATING
270th/ 347
METRIC RANK
6.1%
AMBULATORY DISABILITY
43.1/ 100
METRIC RATING
181st/ 347
METRIC RANK
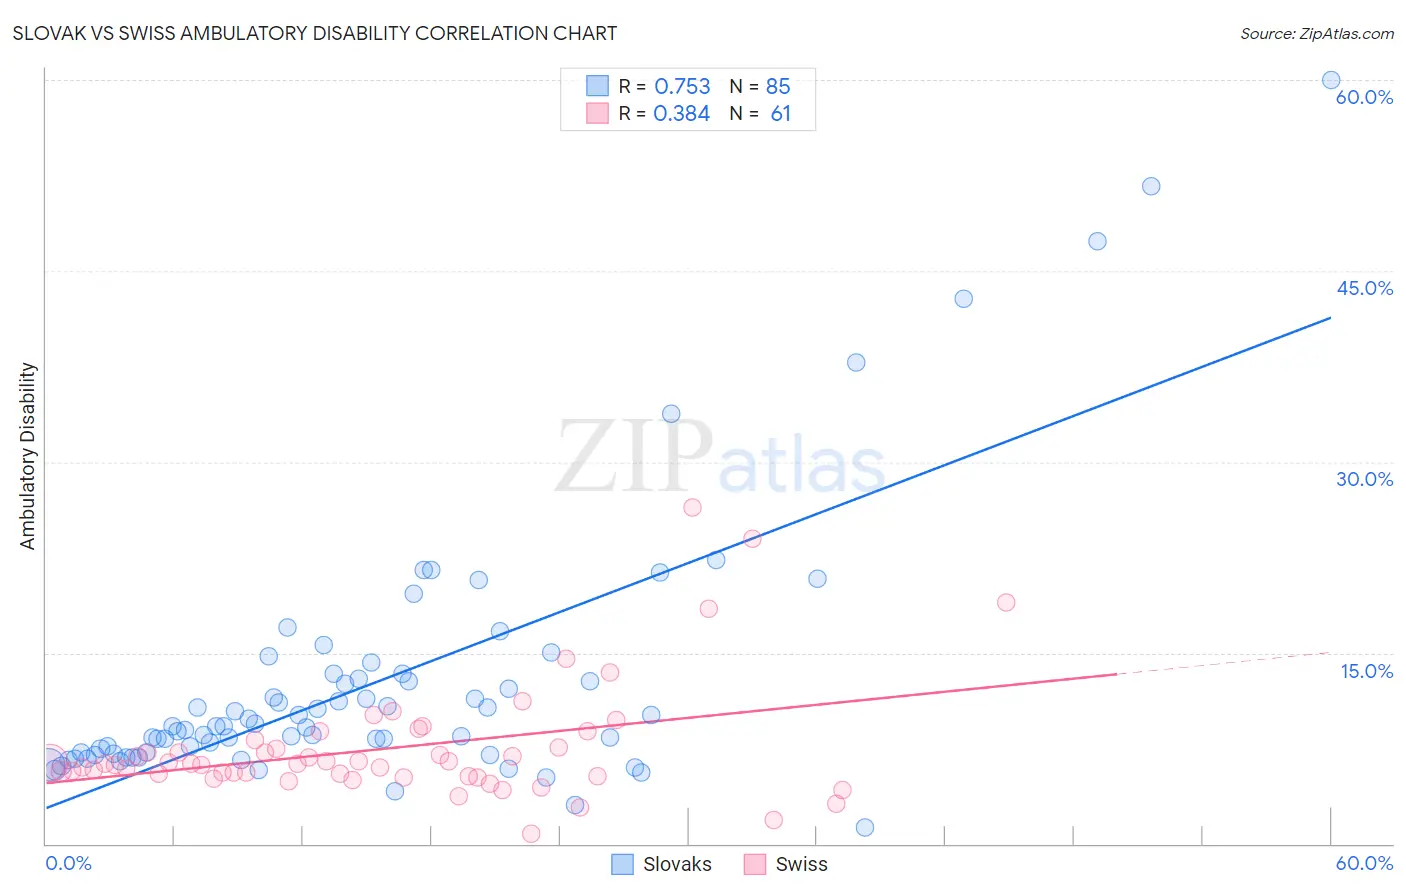
Slovak vs Swiss Ambulatory Disability Correlation Chart
The statistical analysis conducted on geographies consisting of 397,780,873 people shows a strong positive correlation between the proportion of Slovaks and percentage of population with ambulatory disability in the United States with a correlation coefficient (R) of 0.753 and weighted average of 6.7%. Similarly, the statistical analysis conducted on geographies consisting of 464,822,088 people shows a mild positive correlation between the proportion of Swiss and percentage of population with ambulatory disability in the United States with a correlation coefficient (R) of 0.384 and weighted average of 6.1%, a difference of 8.5%.
Ambulatory Disability Correlation Summary
| Measurement | Slovak | Swiss |
| Minimum | 1.3% | 0.81% |
| Maximum | 60.0% | 26.5% |
| Range | 58.7% | 25.7% |
| Mean | 12.6% | 7.5% |
| Median | 9.2% | 6.3% |
| Interquartile 25% (IQ1) | 7.0% | 5.3% |
| Interquartile 75% (IQ3) | 13.2% | 7.8% |
| Interquartile Range (IQR) | 6.1% | 2.6% |
| Standard Deviation (Sample) | 10.4% | 4.6% |
| Standard Deviation (Population) | 10.3% | 4.6% |
Similar Demographics by Ambulatory Disability
Demographics Similar to Slovaks by Ambulatory Disability
In terms of ambulatory disability, the demographic groups most similar to Slovaks are Immigrants from Trinidad and Tobago (6.7%, a difference of 0.10%), French (6.6%, a difference of 0.16%), French Canadian (6.7%, a difference of 0.46%), Spanish (6.6%, a difference of 0.47%), and Trinidadian and Tobagonian (6.6%, a difference of 0.48%).
| Demographics | Rating | Rank | Ambulatory Disability |
| Hmong | 0.3 /100 | #263 | Tragic 6.6% |
| Nepalese | 0.2 /100 | #264 | Tragic 6.6% |
| Bahamians | 0.2 /100 | #265 | Tragic 6.6% |
| Guyanese | 0.2 /100 | #266 | Tragic 6.6% |
| Trinidadians and Tobagonians | 0.2 /100 | #267 | Tragic 6.6% |
| Spanish | 0.2 /100 | #268 | Tragic 6.6% |
| French | 0.1 /100 | #269 | Tragic 6.6% |
| Slovaks | 0.1 /100 | #270 | Tragic 6.7% |
| Immigrants | Trinidad and Tobago | 0.1 /100 | #271 | Tragic 6.7% |
| French Canadians | 0.1 /100 | #272 | Tragic 6.7% |
| Whites/Caucasians | 0.1 /100 | #273 | Tragic 6.7% |
| Sioux | 0.1 /100 | #274 | Tragic 6.7% |
| Immigrants | Guyana | 0.1 /100 | #275 | Tragic 6.7% |
| Celtics | 0.1 /100 | #276 | Tragic 6.7% |
| Jamaicans | 0.1 /100 | #277 | Tragic 6.7% |
Demographics Similar to Swiss by Ambulatory Disability
In terms of ambulatory disability, the demographic groups most similar to Swiss are Serbian (6.1%, a difference of 0.010%), Immigrants from Nicaragua (6.1%, a difference of 0.040%), Austrian (6.1%, a difference of 0.050%), Immigrants from Thailand (6.1%, a difference of 0.050%), and Scandinavian (6.1%, a difference of 0.080%).
| Demographics | Rating | Rank | Ambulatory Disability |
| Immigrants | Canada | 50.0 /100 | #174 | Average 6.1% |
| Vietnamese | 47.2 /100 | #175 | Average 6.1% |
| Immigrants | North America | 45.6 /100 | #176 | Average 6.1% |
| Immigrants | England | 45.4 /100 | #177 | Average 6.1% |
| Scandinavians | 44.5 /100 | #178 | Average 6.1% |
| Austrians | 44.1 /100 | #179 | Average 6.1% |
| Immigrants | Nicaragua | 43.9 /100 | #180 | Average 6.1% |
| Swiss | 43.1 /100 | #181 | Average 6.1% |
| Serbians | 42.8 /100 | #182 | Average 6.1% |
| Immigrants | Thailand | 42.2 /100 | #183 | Average 6.1% |
| Immigrants | Ghana | 41.2 /100 | #184 | Average 6.1% |
| Immigrants | Bosnia and Herzegovina | 37.2 /100 | #185 | Fair 6.2% |
| Europeans | 36.2 /100 | #186 | Fair 6.2% |
| Carpatho Rusyns | 35.3 /100 | #187 | Fair 6.2% |
| British | 34.3 /100 | #188 | Fair 6.2% |