Shoshone vs Immigrants from North Macedonia Ambulatory Disability
COMPARE
Shoshone
Immigrants from North Macedonia
Ambulatory Disability
Ambulatory Disability Comparison
Shoshone
Immigrants from North Macedonia
7.1%
AMBULATORY DISABILITY
0.0/ 100
METRIC RATING
315th/ 347
METRIC RANK
6.0%
AMBULATORY DISABILITY
84.1/ 100
METRIC RATING
136th/ 347
METRIC RANK
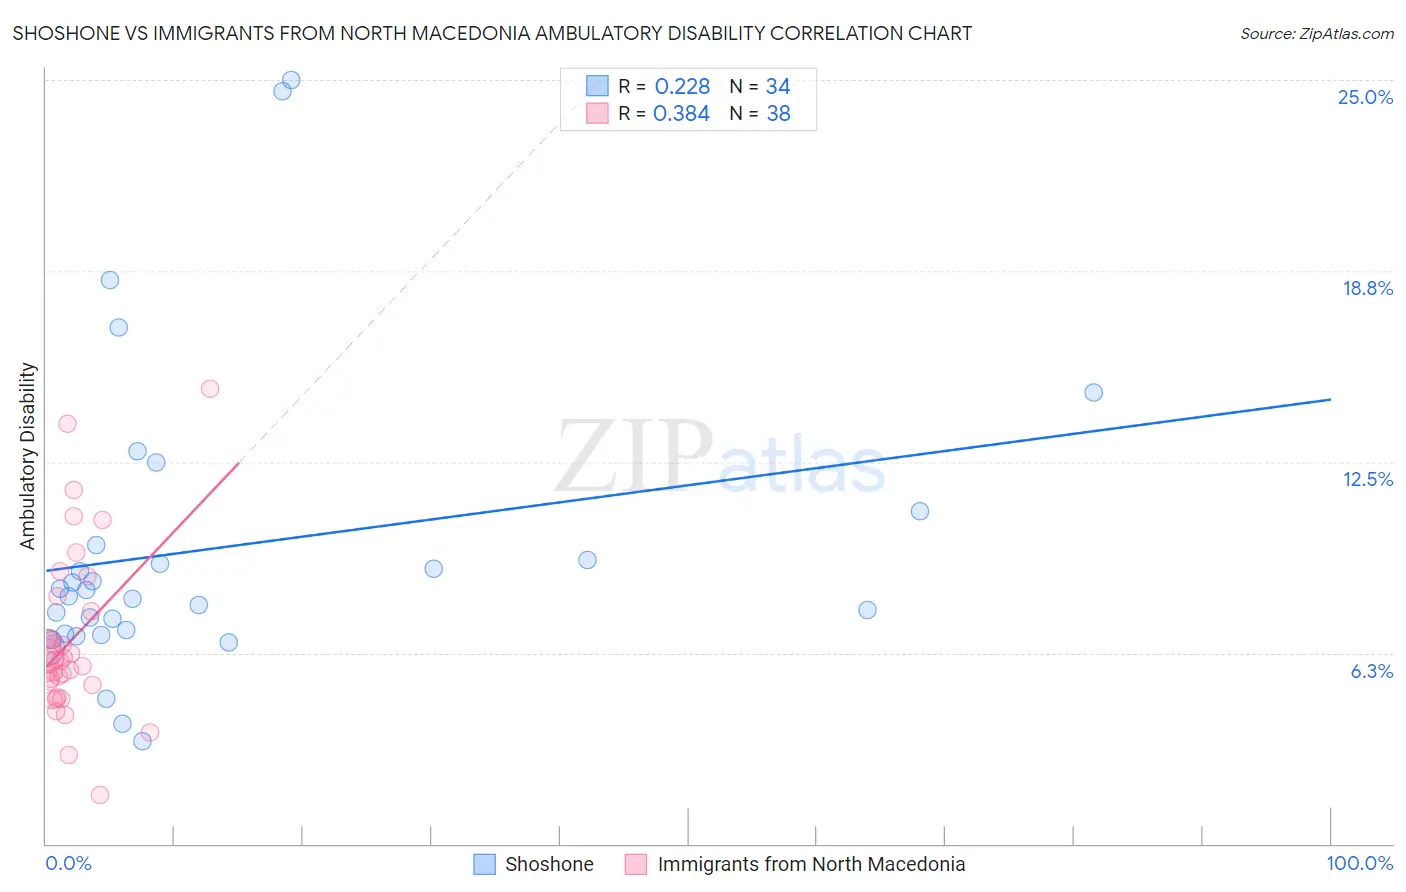
Shoshone vs Immigrants from North Macedonia Ambulatory Disability Correlation Chart
The statistical analysis conducted on geographies consisting of 66,618,747 people shows a weak positive correlation between the proportion of Shoshone and percentage of population with ambulatory disability in the United States with a correlation coefficient (R) of 0.228 and weighted average of 7.1%. Similarly, the statistical analysis conducted on geographies consisting of 74,316,752 people shows a mild positive correlation between the proportion of Immigrants from North Macedonia and percentage of population with ambulatory disability in the United States with a correlation coefficient (R) of 0.384 and weighted average of 6.0%, a difference of 19.2%.
Ambulatory Disability Correlation Summary
| Measurement | Shoshone | Immigrants from North Macedonia |
| Minimum | 3.4% | 1.6% |
| Maximum | 25.0% | 14.9% |
| Range | 21.6% | 13.3% |
| Mean | 9.7% | 6.6% |
| Median | 8.2% | 6.0% |
| Interquartile 25% (IQ1) | 6.9% | 5.2% |
| Interquartile 75% (IQ3) | 9.8% | 7.6% |
| Interquartile Range (IQR) | 2.9% | 2.4% |
| Standard Deviation (Sample) | 5.0% | 2.8% |
| Standard Deviation (Population) | 4.9% | 2.7% |
Similar Demographics by Ambulatory Disability
Demographics Similar to Shoshone by Ambulatory Disability
In terms of ambulatory disability, the demographic groups most similar to Shoshone are Blackfeet (7.1%, a difference of 0.020%), Immigrants from Yemen (7.1%, a difference of 0.040%), Delaware (7.1%, a difference of 0.17%), Immigrants from Dominican Republic (7.1%, a difference of 0.24%), and Central American Indian (7.2%, a difference of 0.32%).
| Demographics | Rating | Rank | Ambulatory Disability |
| Chippewa | 0.0 /100 | #308 | Tragic 7.1% |
| Immigrants | Azores | 0.0 /100 | #309 | Tragic 7.1% |
| Arapaho | 0.0 /100 | #310 | Tragic 7.1% |
| Cree | 0.0 /100 | #311 | Tragic 7.1% |
| Delaware | 0.0 /100 | #312 | Tragic 7.1% |
| Immigrants | Yemen | 0.0 /100 | #313 | Tragic 7.1% |
| Blackfeet | 0.0 /100 | #314 | Tragic 7.1% |
| Shoshone | 0.0 /100 | #315 | Tragic 7.1% |
| Immigrants | Dominican Republic | 0.0 /100 | #316 | Tragic 7.1% |
| Central American Indians | 0.0 /100 | #317 | Tragic 7.2% |
| Ottawa | 0.0 /100 | #318 | Tragic 7.2% |
| Dominicans | 0.0 /100 | #319 | Tragic 7.2% |
| Potawatomi | 0.0 /100 | #320 | Tragic 7.3% |
| Apache | 0.0 /100 | #321 | Tragic 7.4% |
| Osage | 0.0 /100 | #322 | Tragic 7.4% |
Demographics Similar to Immigrants from North Macedonia by Ambulatory Disability
In terms of ambulatory disability, the demographic groups most similar to Immigrants from North Macedonia are Immigrants from Syria (6.0%, a difference of 0.0%), Immigrants from Hungary (6.0%, a difference of 0.020%), Immigrants from Zaire (6.0%, a difference of 0.050%), Czech (6.0%, a difference of 0.080%), and Immigrants from Italy (6.0%, a difference of 0.090%).
| Demographics | Rating | Rank | Ambulatory Disability |
| Immigrants | Norway | 90.5 /100 | #129 | Exceptional 5.9% |
| Immigrants | Kazakhstan | 89.7 /100 | #130 | Excellent 5.9% |
| Immigrants | Costa Rica | 89.5 /100 | #131 | Excellent 5.9% |
| Immigrants | Europe | 87.8 /100 | #132 | Excellent 6.0% |
| Immigrants | Immigrants | 86.9 /100 | #133 | Excellent 6.0% |
| Ute | 86.6 /100 | #134 | Excellent 6.0% |
| Immigrants | Italy | 85.0 /100 | #135 | Excellent 6.0% |
| Immigrants | North Macedonia | 84.1 /100 | #136 | Excellent 6.0% |
| Immigrants | Syria | 84.1 /100 | #137 | Excellent 6.0% |
| Immigrants | Hungary | 83.9 /100 | #138 | Excellent 6.0% |
| Immigrants | Zaire | 83.6 /100 | #139 | Excellent 6.0% |
| Czechs | 83.3 /100 | #140 | Excellent 6.0% |
| Swedes | 83.1 /100 | #141 | Excellent 6.0% |
| Immigrants | Philippines | 83.0 /100 | #142 | Excellent 6.0% |
| Romanians | 82.9 /100 | #143 | Excellent 6.0% |