Shoshone vs Hopi Ambulatory Disability
COMPARE
Shoshone
Hopi
Ambulatory Disability
Ambulatory Disability Comparison
Shoshone
Hopi
7.1%
AMBULATORY DISABILITY
0.0/ 100
METRIC RATING
315th/ 347
METRIC RANK
7.6%
AMBULATORY DISABILITY
0.0/ 100
METRIC RATING
328th/ 347
METRIC RANK
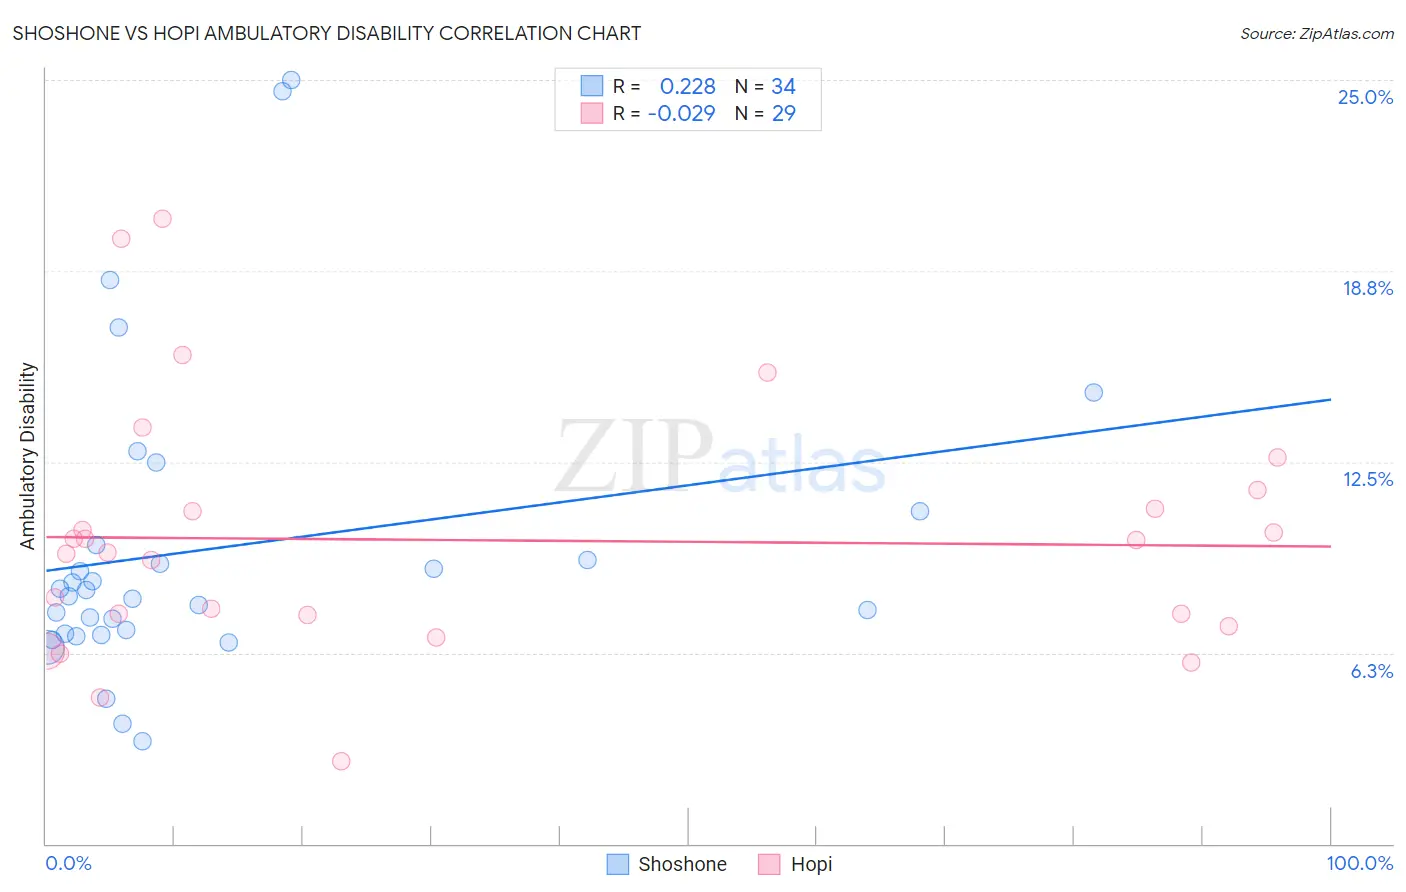
Shoshone vs Hopi Ambulatory Disability Correlation Chart
The statistical analysis conducted on geographies consisting of 66,618,747 people shows a weak positive correlation between the proportion of Shoshone and percentage of population with ambulatory disability in the United States with a correlation coefficient (R) of 0.228 and weighted average of 7.1%. Similarly, the statistical analysis conducted on geographies consisting of 74,727,187 people shows no correlation between the proportion of Hopi and percentage of population with ambulatory disability in the United States with a correlation coefficient (R) of -0.029 and weighted average of 7.6%, a difference of 6.5%.
Ambulatory Disability Correlation Summary
| Measurement | Shoshone | Hopi |
| Minimum | 3.4% | 2.7% |
| Maximum | 25.0% | 20.4% |
| Range | 21.6% | 17.7% |
| Mean | 9.7% | 9.9% |
| Median | 8.2% | 9.5% |
| Interquartile 25% (IQ1) | 6.9% | 7.3% |
| Interquartile 75% (IQ3) | 9.8% | 11.3% |
| Interquartile Range (IQR) | 2.9% | 4.0% |
| Standard Deviation (Sample) | 5.0% | 4.1% |
| Standard Deviation (Population) | 4.9% | 4.0% |
Demographics Similar to Shoshone and Hopi by Ambulatory Disability
In terms of ambulatory disability, the demographic groups most similar to Shoshone are Blackfeet (7.1%, a difference of 0.020%), Immigrants from Yemen (7.1%, a difference of 0.040%), Delaware (7.1%, a difference of 0.17%), Immigrants from Dominican Republic (7.1%, a difference of 0.24%), and Central American Indian (7.2%, a difference of 0.32%). Similarly, the demographic groups most similar to Hopi are Pueblo (7.6%, a difference of 0.040%), Native/Alaskan (7.5%, a difference of 0.94%), Black/African American (7.5%, a difference of 0.95%), Comanche (7.5%, a difference of 1.1%), and Navajo (7.5%, a difference of 1.1%).
| Demographics | Rating | Rank | Ambulatory Disability |
| Cree | 0.0 /100 | #311 | Tragic 7.1% |
| Delaware | 0.0 /100 | #312 | Tragic 7.1% |
| Immigrants | Yemen | 0.0 /100 | #313 | Tragic 7.1% |
| Blackfeet | 0.0 /100 | #314 | Tragic 7.1% |
| Shoshone | 0.0 /100 | #315 | Tragic 7.1% |
| Immigrants | Dominican Republic | 0.0 /100 | #316 | Tragic 7.1% |
| Central American Indians | 0.0 /100 | #317 | Tragic 7.2% |
| Ottawa | 0.0 /100 | #318 | Tragic 7.2% |
| Dominicans | 0.0 /100 | #319 | Tragic 7.2% |
| Potawatomi | 0.0 /100 | #320 | Tragic 7.3% |
| Apache | 0.0 /100 | #321 | Tragic 7.4% |
| Osage | 0.0 /100 | #322 | Tragic 7.4% |
| Americans | 0.0 /100 | #323 | Tragic 7.4% |
| Navajo | 0.0 /100 | #324 | Tragic 7.5% |
| Comanche | 0.0 /100 | #325 | Tragic 7.5% |
| Blacks/African Americans | 0.0 /100 | #326 | Tragic 7.5% |
| Natives/Alaskans | 0.0 /100 | #327 | Tragic 7.5% |
| Hopi | 0.0 /100 | #328 | Tragic 7.6% |
| Pueblo | 0.0 /100 | #329 | Tragic 7.6% |
| Paiute | 0.0 /100 | #330 | Tragic 7.7% |
| Cajuns | 0.0 /100 | #331 | Tragic 7.8% |