Immigrants from Austria vs Swiss Ambulatory Disability
COMPARE
Immigrants from Austria
Swiss
Ambulatory Disability
Ambulatory Disability Comparison
Immigrants from Austria
Swiss
6.0%
AMBULATORY DISABILITY
78.8/ 100
METRIC RATING
152nd/ 347
METRIC RANK
6.1%
AMBULATORY DISABILITY
43.1/ 100
METRIC RATING
181st/ 347
METRIC RANK
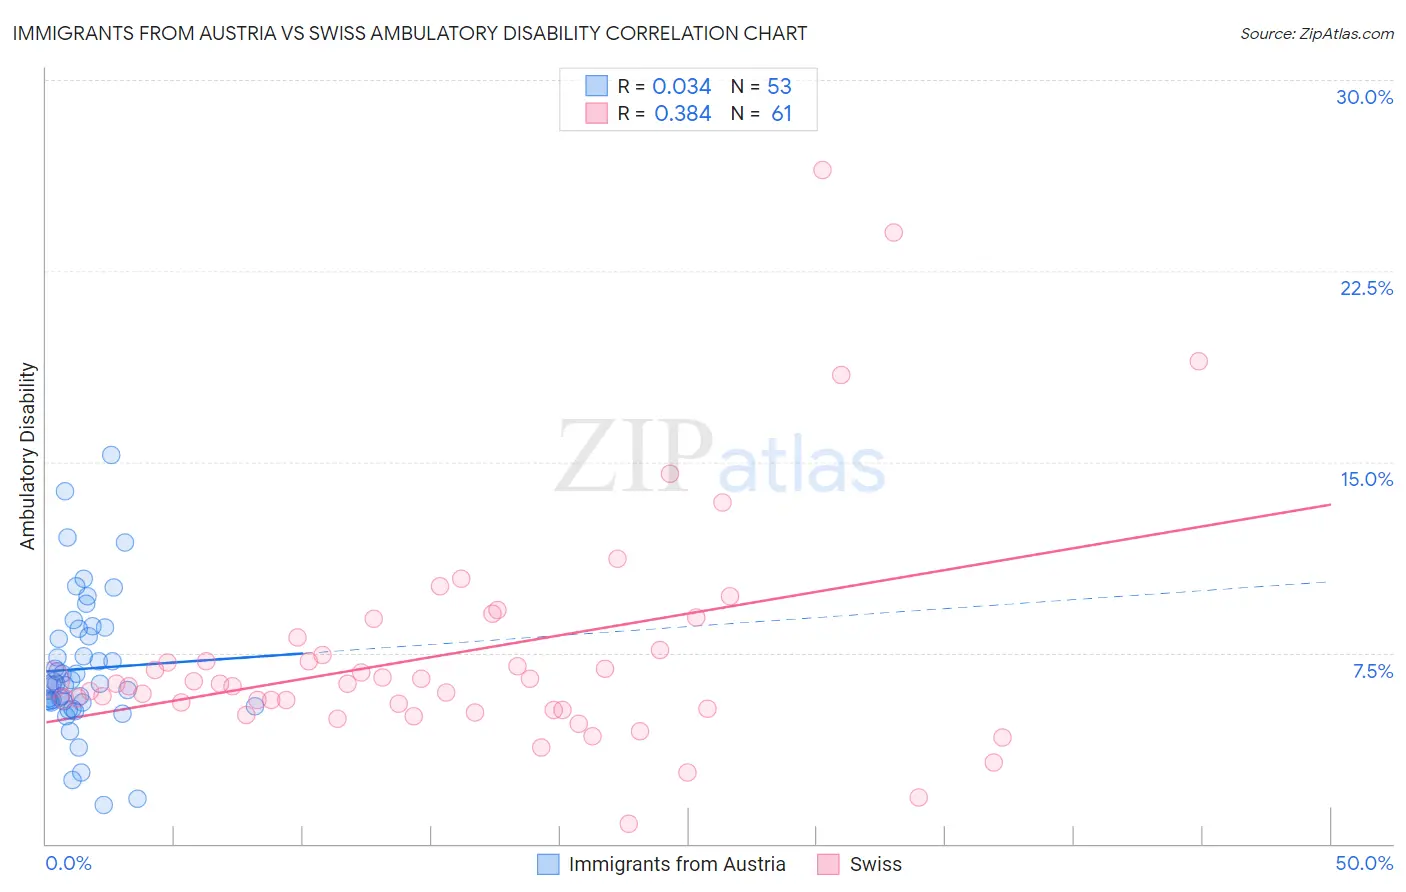
Immigrants from Austria vs Swiss Ambulatory Disability Correlation Chart
The statistical analysis conducted on geographies consisting of 167,968,225 people shows no correlation between the proportion of Immigrants from Austria and percentage of population with ambulatory disability in the United States with a correlation coefficient (R) of 0.034 and weighted average of 6.0%. Similarly, the statistical analysis conducted on geographies consisting of 464,822,088 people shows a mild positive correlation between the proportion of Swiss and percentage of population with ambulatory disability in the United States with a correlation coefficient (R) of 0.384 and weighted average of 6.1%, a difference of 2.1%.
Ambulatory Disability Correlation Summary
| Measurement | Immigrants from Austria | Swiss |
| Minimum | 1.5% | 0.81% |
| Maximum | 15.3% | 26.5% |
| Range | 13.8% | 25.7% |
| Mean | 6.9% | 7.5% |
| Median | 6.3% | 6.3% |
| Interquartile 25% (IQ1) | 5.6% | 5.3% |
| Interquartile 75% (IQ3) | 8.3% | 7.8% |
| Interquartile Range (IQR) | 2.7% | 2.6% |
| Standard Deviation (Sample) | 2.7% | 4.6% |
| Standard Deviation (Population) | 2.7% | 4.6% |
Similar Demographics by Ambulatory Disability
Demographics Similar to Immigrants from Austria by Ambulatory Disability
In terms of ambulatory disability, the demographic groups most similar to Immigrants from Austria are Greek (6.0%, a difference of 0.070%), Maltese (6.0%, a difference of 0.25%), Syrian (6.0%, a difference of 0.25%), Lithuanian (6.0%, a difference of 0.27%), and Immigrants from Eastern Europe (6.0%, a difference of 0.28%).
| Demographics | Rating | Rank | Ambulatory Disability |
| Pakistanis | 82.5 /100 | #145 | Excellent 6.0% |
| Immigrants | Greece | 82.5 /100 | #146 | Excellent 6.0% |
| Immigrants | Moldova | 82.4 /100 | #147 | Excellent 6.0% |
| Immigrants | Eastern Europe | 82.0 /100 | #148 | Excellent 6.0% |
| Lithuanians | 81.9 /100 | #149 | Excellent 6.0% |
| Maltese | 81.6 /100 | #150 | Excellent 6.0% |
| Greeks | 79.6 /100 | #151 | Good 6.0% |
| Immigrants | Austria | 78.8 /100 | #152 | Good 6.0% |
| Syrians | 75.5 /100 | #153 | Good 6.0% |
| Immigrants | Croatia | 75.1 /100 | #154 | Good 6.0% |
| Immigrants | Scotland | 72.1 /100 | #155 | Good 6.0% |
| Northern Europeans | 71.8 /100 | #156 | Good 6.0% |
| Ghanaians | 71.3 /100 | #157 | Good 6.0% |
| Immigrants | Fiji | 71.2 /100 | #158 | Good 6.0% |
| Immigrants | Latvia | 71.1 /100 | #159 | Good 6.0% |
Demographics Similar to Swiss by Ambulatory Disability
In terms of ambulatory disability, the demographic groups most similar to Swiss are Serbian (6.1%, a difference of 0.010%), Immigrants from Nicaragua (6.1%, a difference of 0.040%), Austrian (6.1%, a difference of 0.050%), Immigrants from Thailand (6.1%, a difference of 0.050%), and Scandinavian (6.1%, a difference of 0.080%).
| Demographics | Rating | Rank | Ambulatory Disability |
| Immigrants | Canada | 50.0 /100 | #174 | Average 6.1% |
| Vietnamese | 47.2 /100 | #175 | Average 6.1% |
| Immigrants | North America | 45.6 /100 | #176 | Average 6.1% |
| Immigrants | England | 45.4 /100 | #177 | Average 6.1% |
| Scandinavians | 44.5 /100 | #178 | Average 6.1% |
| Austrians | 44.1 /100 | #179 | Average 6.1% |
| Immigrants | Nicaragua | 43.9 /100 | #180 | Average 6.1% |
| Swiss | 43.1 /100 | #181 | Average 6.1% |
| Serbians | 42.8 /100 | #182 | Average 6.1% |
| Immigrants | Thailand | 42.2 /100 | #183 | Average 6.1% |
| Immigrants | Ghana | 41.2 /100 | #184 | Average 6.1% |
| Immigrants | Bosnia and Herzegovina | 37.2 /100 | #185 | Fair 6.2% |
| Europeans | 36.2 /100 | #186 | Fair 6.2% |
| Carpatho Rusyns | 35.3 /100 | #187 | Fair 6.2% |
| British | 34.3 /100 | #188 | Fair 6.2% |