Shoshone vs Colville Ambulatory Disability
COMPARE
Shoshone
Colville
Ambulatory Disability
Ambulatory Disability Comparison
Shoshone
Colville
7.1%
AMBULATORY DISABILITY
0.0/ 100
METRIC RATING
315th/ 347
METRIC RANK
8.2%
AMBULATORY DISABILITY
0.0/ 100
METRIC RATING
338th/ 347
METRIC RANK
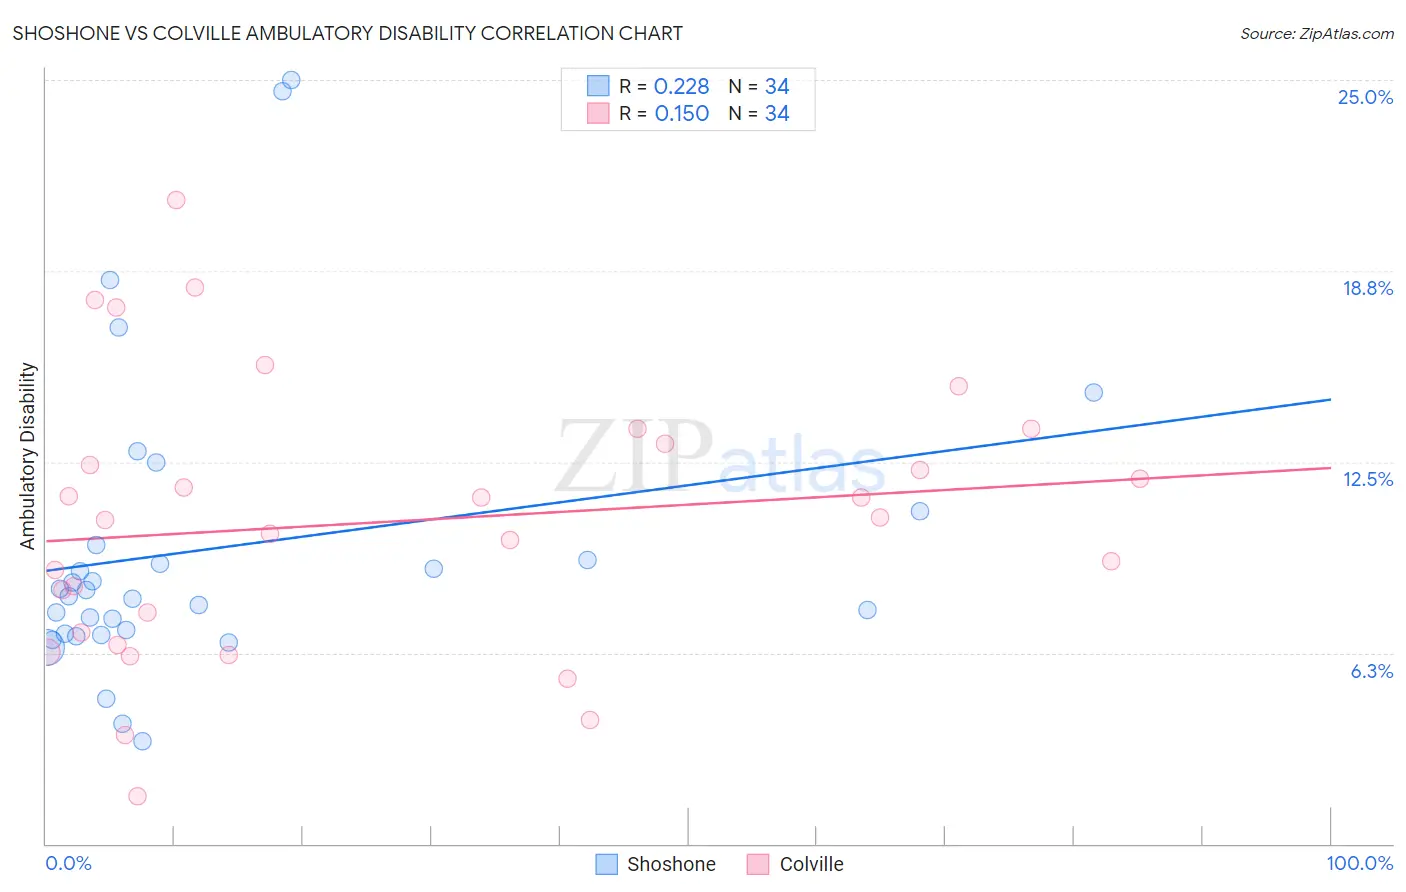
Shoshone vs Colville Ambulatory Disability Correlation Chart
The statistical analysis conducted on geographies consisting of 66,618,747 people shows a weak positive correlation between the proportion of Shoshone and percentage of population with ambulatory disability in the United States with a correlation coefficient (R) of 0.228 and weighted average of 7.1%. Similarly, the statistical analysis conducted on geographies consisting of 34,678,194 people shows a poor positive correlation between the proportion of Colville and percentage of population with ambulatory disability in the United States with a correlation coefficient (R) of 0.150 and weighted average of 8.2%, a difference of 15.2%.
Ambulatory Disability Correlation Summary
| Measurement | Shoshone | Colville |
| Minimum | 3.4% | 1.6% |
| Maximum | 25.0% | 21.1% |
| Range | 21.6% | 19.5% |
| Mean | 9.7% | 10.5% |
| Median | 8.2% | 10.6% |
| Interquartile 25% (IQ1) | 6.9% | 6.9% |
| Interquartile 75% (IQ3) | 9.8% | 13.1% |
| Interquartile Range (IQR) | 2.9% | 6.2% |
| Standard Deviation (Sample) | 5.0% | 4.5% |
| Standard Deviation (Population) | 4.9% | 4.4% |
Similar Demographics by Ambulatory Disability
Demographics Similar to Shoshone by Ambulatory Disability
In terms of ambulatory disability, the demographic groups most similar to Shoshone are Blackfeet (7.1%, a difference of 0.020%), Immigrants from Yemen (7.1%, a difference of 0.040%), Delaware (7.1%, a difference of 0.17%), Immigrants from Dominican Republic (7.1%, a difference of 0.24%), and Central American Indian (7.2%, a difference of 0.32%).
| Demographics | Rating | Rank | Ambulatory Disability |
| Chippewa | 0.0 /100 | #308 | Tragic 7.1% |
| Immigrants | Azores | 0.0 /100 | #309 | Tragic 7.1% |
| Arapaho | 0.0 /100 | #310 | Tragic 7.1% |
| Cree | 0.0 /100 | #311 | Tragic 7.1% |
| Delaware | 0.0 /100 | #312 | Tragic 7.1% |
| Immigrants | Yemen | 0.0 /100 | #313 | Tragic 7.1% |
| Blackfeet | 0.0 /100 | #314 | Tragic 7.1% |
| Shoshone | 0.0 /100 | #315 | Tragic 7.1% |
| Immigrants | Dominican Republic | 0.0 /100 | #316 | Tragic 7.1% |
| Central American Indians | 0.0 /100 | #317 | Tragic 7.2% |
| Ottawa | 0.0 /100 | #318 | Tragic 7.2% |
| Dominicans | 0.0 /100 | #319 | Tragic 7.2% |
| Potawatomi | 0.0 /100 | #320 | Tragic 7.3% |
| Apache | 0.0 /100 | #321 | Tragic 7.4% |
| Osage | 0.0 /100 | #322 | Tragic 7.4% |
Demographics Similar to Colville by Ambulatory Disability
In terms of ambulatory disability, the demographic groups most similar to Colville are Pima (8.2%, a difference of 0.35%), Dutch West Indian (8.2%, a difference of 0.57%), Choctaw (8.3%, a difference of 1.2%), Seminole (8.0%, a difference of 2.2%), and Chickasaw (8.0%, a difference of 2.3%).
| Demographics | Rating | Rank | Ambulatory Disability |
| Cajuns | 0.0 /100 | #331 | Tragic 7.8% |
| Menominee | 0.0 /100 | #332 | Tragic 7.8% |
| Cherokee | 0.0 /100 | #333 | Tragic 7.9% |
| Yuman | 0.0 /100 | #334 | Tragic 7.9% |
| Chickasaw | 0.0 /100 | #335 | Tragic 8.0% |
| Seminole | 0.0 /100 | #336 | Tragic 8.0% |
| Dutch West Indians | 0.0 /100 | #337 | Tragic 8.2% |
| Colville | 0.0 /100 | #338 | Tragic 8.2% |
| Pima | 0.0 /100 | #339 | Tragic 8.2% |
| Choctaw | 0.0 /100 | #340 | Tragic 8.3% |
| Creek | 0.0 /100 | #341 | Tragic 8.5% |
| Kiowa | 0.0 /100 | #342 | Tragic 8.6% |
| Tohono O'odham | 0.0 /100 | #343 | Tragic 8.7% |
| Tsimshian | 0.0 /100 | #344 | Tragic 8.8% |
| Puerto Ricans | 0.0 /100 | #345 | Tragic 8.9% |