Shoshone vs Indonesian Ambulatory Disability
COMPARE
Shoshone
Indonesian
Ambulatory Disability
Ambulatory Disability Comparison
Shoshone
Indonesians
7.1%
AMBULATORY DISABILITY
0.0/ 100
METRIC RATING
315th/ 347
METRIC RANK
6.3%
AMBULATORY DISABILITY
9.9/ 100
METRIC RATING
219th/ 347
METRIC RANK
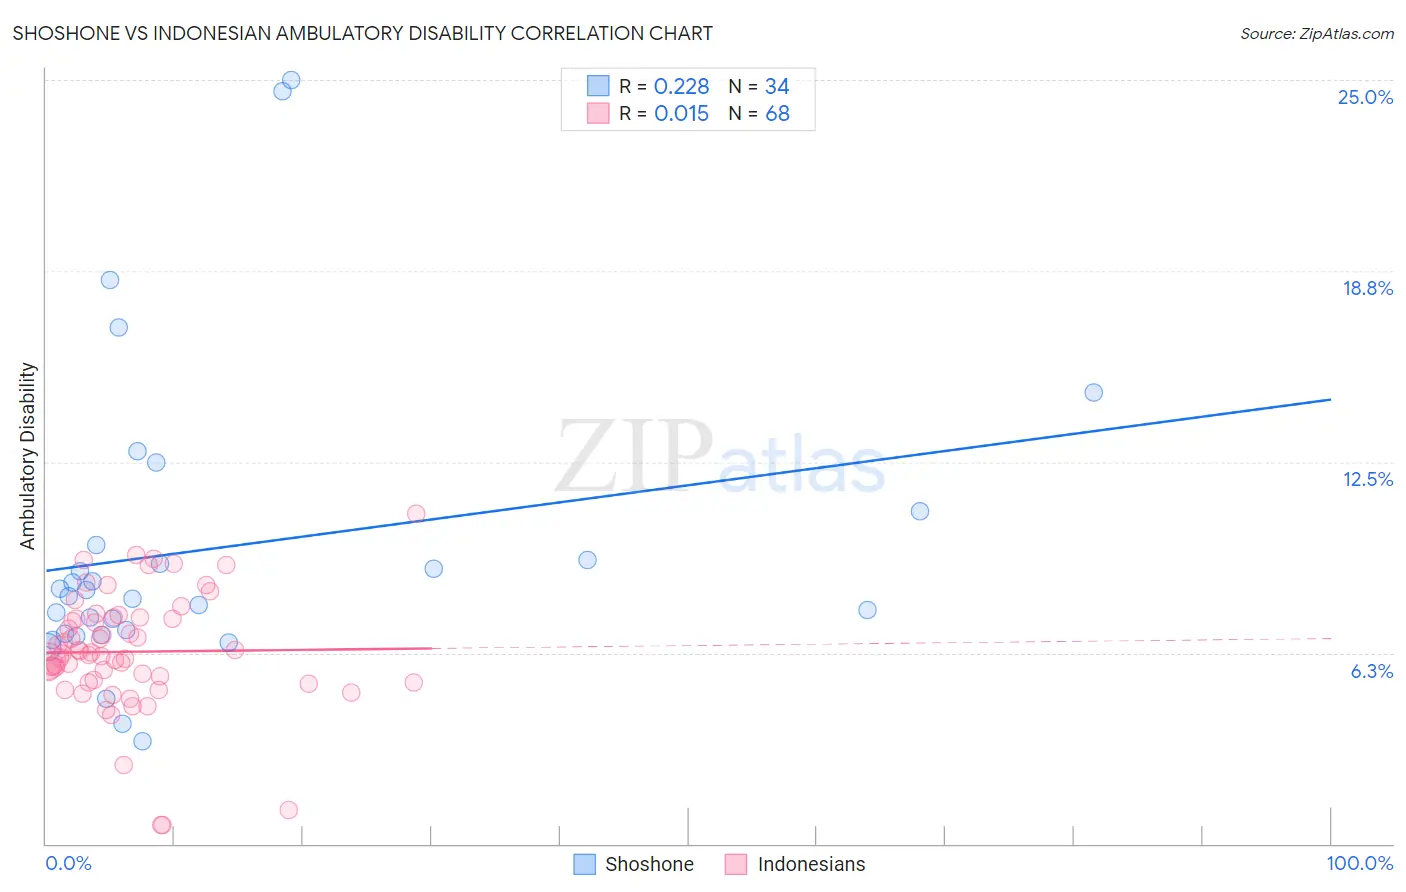
Shoshone vs Indonesian Ambulatory Disability Correlation Chart
The statistical analysis conducted on geographies consisting of 66,618,747 people shows a weak positive correlation between the proportion of Shoshone and percentage of population with ambulatory disability in the United States with a correlation coefficient (R) of 0.228 and weighted average of 7.1%. Similarly, the statistical analysis conducted on geographies consisting of 162,682,177 people shows no correlation between the proportion of Indonesians and percentage of population with ambulatory disability in the United States with a correlation coefficient (R) of 0.015 and weighted average of 6.3%, a difference of 13.3%.
Ambulatory Disability Correlation Summary
| Measurement | Shoshone | Indonesian |
| Minimum | 3.4% | 0.59% |
| Maximum | 25.0% | 10.8% |
| Range | 21.6% | 10.2% |
| Mean | 9.7% | 6.3% |
| Median | 8.2% | 6.2% |
| Interquartile 25% (IQ1) | 6.9% | 5.3% |
| Interquartile 75% (IQ3) | 9.8% | 7.4% |
| Interquartile Range (IQR) | 2.9% | 2.1% |
| Standard Deviation (Sample) | 5.0% | 1.9% |
| Standard Deviation (Population) | 4.9% | 1.9% |
Similar Demographics by Ambulatory Disability
Demographics Similar to Shoshone by Ambulatory Disability
In terms of ambulatory disability, the demographic groups most similar to Shoshone are Blackfeet (7.1%, a difference of 0.020%), Immigrants from Yemen (7.1%, a difference of 0.040%), Delaware (7.1%, a difference of 0.17%), Immigrants from Dominican Republic (7.1%, a difference of 0.24%), and Central American Indian (7.2%, a difference of 0.32%).
| Demographics | Rating | Rank | Ambulatory Disability |
| Chippewa | 0.0 /100 | #308 | Tragic 7.1% |
| Immigrants | Azores | 0.0 /100 | #309 | Tragic 7.1% |
| Arapaho | 0.0 /100 | #310 | Tragic 7.1% |
| Cree | 0.0 /100 | #311 | Tragic 7.1% |
| Delaware | 0.0 /100 | #312 | Tragic 7.1% |
| Immigrants | Yemen | 0.0 /100 | #313 | Tragic 7.1% |
| Blackfeet | 0.0 /100 | #314 | Tragic 7.1% |
| Shoshone | 0.0 /100 | #315 | Tragic 7.1% |
| Immigrants | Dominican Republic | 0.0 /100 | #316 | Tragic 7.1% |
| Central American Indians | 0.0 /100 | #317 | Tragic 7.2% |
| Ottawa | 0.0 /100 | #318 | Tragic 7.2% |
| Dominicans | 0.0 /100 | #319 | Tragic 7.2% |
| Potawatomi | 0.0 /100 | #320 | Tragic 7.3% |
| Apache | 0.0 /100 | #321 | Tragic 7.4% |
| Osage | 0.0 /100 | #322 | Tragic 7.4% |
Demographics Similar to Indonesians by Ambulatory Disability
In terms of ambulatory disability, the demographic groups most similar to Indonesians are Immigrants from Albania (6.3%, a difference of 0.040%), Hungarian (6.3%, a difference of 0.050%), German Russian (6.3%, a difference of 0.070%), Guamanian/Chamorro (6.3%, a difference of 0.10%), and Canadian (6.3%, a difference of 0.14%).
| Demographics | Rating | Rank | Ambulatory Disability |
| Mexican American Indians | 12.0 /100 | #212 | Poor 6.3% |
| Japanese | 12.0 /100 | #213 | Poor 6.3% |
| Immigrants | Mexico | 11.0 /100 | #214 | Poor 6.3% |
| Immigrants | Latin America | 11.0 /100 | #215 | Poor 6.3% |
| Canadians | 10.9 /100 | #216 | Poor 6.3% |
| Yugoslavians | 10.9 /100 | #217 | Poor 6.3% |
| Guamanians/Chamorros | 10.6 /100 | #218 | Poor 6.3% |
| Indonesians | 9.9 /100 | #219 | Tragic 6.3% |
| Immigrants | Albania | 9.6 /100 | #220 | Tragic 6.3% |
| Hungarians | 9.6 /100 | #221 | Tragic 6.3% |
| German Russians | 9.4 /100 | #222 | Tragic 6.3% |
| Immigrants | Honduras | 7.6 /100 | #223 | Tragic 6.3% |
| Liberians | 7.1 /100 | #224 | Tragic 6.3% |
| Hondurans | 6.3 /100 | #225 | Tragic 6.3% |
| Slavs | 5.1 /100 | #226 | Tragic 6.4% |