Shoshone vs Swiss Householder Income Ages 45 - 64 years
COMPARE
Shoshone
Swiss
Householder Income Ages 45 - 64 years
Householder Income Ages 45 - 64 years Comparison
Shoshone
Swiss
$83,588
HOUSEHOLDER INCOME AGES 45 - 64 YEARS
0.0/ 100
METRIC RATING
307th/ 347
METRIC RANK
$103,071
HOUSEHOLDER INCOME AGES 45 - 64 YEARS
79.9/ 100
METRIC RATING
151st/ 347
METRIC RANK
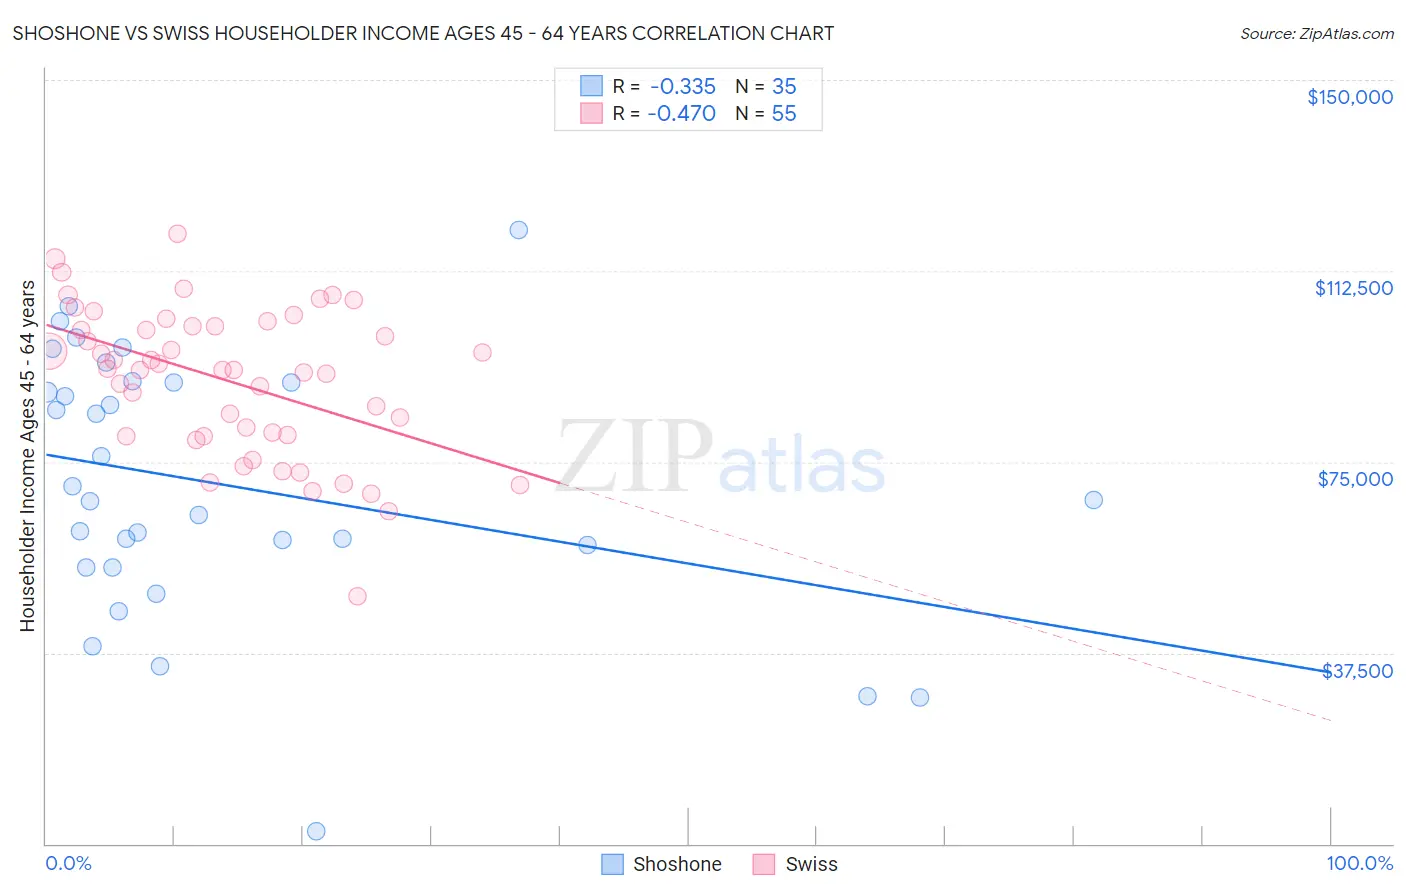
Shoshone vs Swiss Householder Income Ages 45 - 64 years Correlation Chart
The statistical analysis conducted on geographies consisting of 66,599,308 people shows a mild negative correlation between the proportion of Shoshone and household income with householder between the ages 45 and 64 in the United States with a correlation coefficient (R) of -0.335 and weighted average of $83,588. Similarly, the statistical analysis conducted on geographies consisting of 463,835,295 people shows a moderate negative correlation between the proportion of Swiss and household income with householder between the ages 45 and 64 in the United States with a correlation coefficient (R) of -0.470 and weighted average of $103,071, a difference of 23.3%.
Householder Income Ages 45 - 64 years Correlation Summary
| Measurement | Shoshone | Swiss |
| Minimum | $2,499 | $48,631 |
| Maximum | $120,500 | $119,830 |
| Range | $118,001 | $71,199 |
| Mean | $70,433 | $90,919 |
| Median | $67,500 | $93,146 |
| Interquartile 25% (IQ1) | $54,344 | $80,104 |
| Interquartile 75% (IQ3) | $90,536 | $101,628 |
| Interquartile Range (IQR) | $36,192 | $21,524 |
| Standard Deviation (Sample) | $25,918 | $14,599 |
| Standard Deviation (Population) | $25,545 | $14,465 |
Similar Demographics by Householder Income Ages 45 - 64 years
Demographics Similar to Shoshone by Householder Income Ages 45 - 64 years
In terms of householder income ages 45 - 64 years, the demographic groups most similar to Shoshone are Immigrants from Cabo Verde ($83,542, a difference of 0.060%), Immigrants from Dominica ($83,311, a difference of 0.33%), Immigrants from Haiti ($83,257, a difference of 0.40%), Ute ($83,937, a difference of 0.42%), and Chippewa ($83,943, a difference of 0.43%).
| Demographics | Rating | Rank | Householder Income Ages 45 - 64 years |
| Indonesians | 0.0 /100 | #300 | Tragic $84,890 |
| Potawatomi | 0.0 /100 | #301 | Tragic $84,613 |
| Haitians | 0.0 /100 | #302 | Tragic $84,384 |
| Hondurans | 0.0 /100 | #303 | Tragic $84,079 |
| Ottawa | 0.0 /100 | #304 | Tragic $83,953 |
| Chippewa | 0.0 /100 | #305 | Tragic $83,943 |
| Ute | 0.0 /100 | #306 | Tragic $83,937 |
| Shoshone | 0.0 /100 | #307 | Tragic $83,588 |
| Immigrants | Cabo Verde | 0.0 /100 | #308 | Tragic $83,542 |
| Immigrants | Dominica | 0.0 /100 | #309 | Tragic $83,311 |
| Immigrants | Haiti | 0.0 /100 | #310 | Tragic $83,257 |
| Immigrants | Bahamas | 0.0 /100 | #311 | Tragic $83,177 |
| Cajuns | 0.0 /100 | #312 | Tragic $83,015 |
| U.S. Virgin Islanders | 0.0 /100 | #313 | Tragic $82,736 |
| Immigrants | Honduras | 0.0 /100 | #314 | Tragic $82,697 |
Demographics Similar to Swiss by Householder Income Ages 45 - 64 years
In terms of householder income ages 45 - 64 years, the demographic groups most similar to Swiss are Irish ($103,067, a difference of 0.0%), Immigrants from Peru ($103,173, a difference of 0.10%), Scandinavian ($102,969, a difference of 0.10%), Immigrants from Sierra Leone ($103,227, a difference of 0.15%), and Slovene ($102,885, a difference of 0.18%).
| Demographics | Rating | Rank | Householder Income Ages 45 - 64 years |
| Czechs | 83.1 /100 | #144 | Excellent $103,507 |
| Ugandans | 82.9 /100 | #145 | Excellent $103,472 |
| Immigrants | Chile | 82.5 /100 | #146 | Excellent $103,412 |
| Basques | 82.3 /100 | #147 | Excellent $103,387 |
| Immigrants | Germany | 81.5 /100 | #148 | Excellent $103,282 |
| Immigrants | Sierra Leone | 81.1 /100 | #149 | Excellent $103,227 |
| Immigrants | Peru | 80.7 /100 | #150 | Excellent $103,173 |
| Swiss | 79.9 /100 | #151 | Good $103,071 |
| Irish | 79.8 /100 | #152 | Good $103,067 |
| Scandinavians | 79.0 /100 | #153 | Good $102,969 |
| Slovenes | 78.3 /100 | #154 | Good $102,885 |
| Costa Ricans | 77.4 /100 | #155 | Good $102,779 |
| Carpatho Rusyns | 77.4 /100 | #156 | Good $102,777 |
| Immigrants | Ethiopia | 77.3 /100 | #157 | Good $102,763 |
| Slavs | 76.1 /100 | #158 | Good $102,629 |