Shoshone vs Swiss Unemployment Among Ages 25 to 29 years
COMPARE
Shoshone
Swiss
Unemployment Among Ages 25 to 29 years
Unemployment Among Ages 25 to 29 years Comparison
Shoshone
Swiss
9.2%
UNEMPLOYMENT AMONG AGES 25 TO 29 YEARS
0.0/ 100
METRIC RATING
326th/ 347
METRIC RANK
6.4%
UNEMPLOYMENT AMONG AGES 25 TO 29 YEARS
88.6/ 100
METRIC RATING
107th/ 347
METRIC RANK
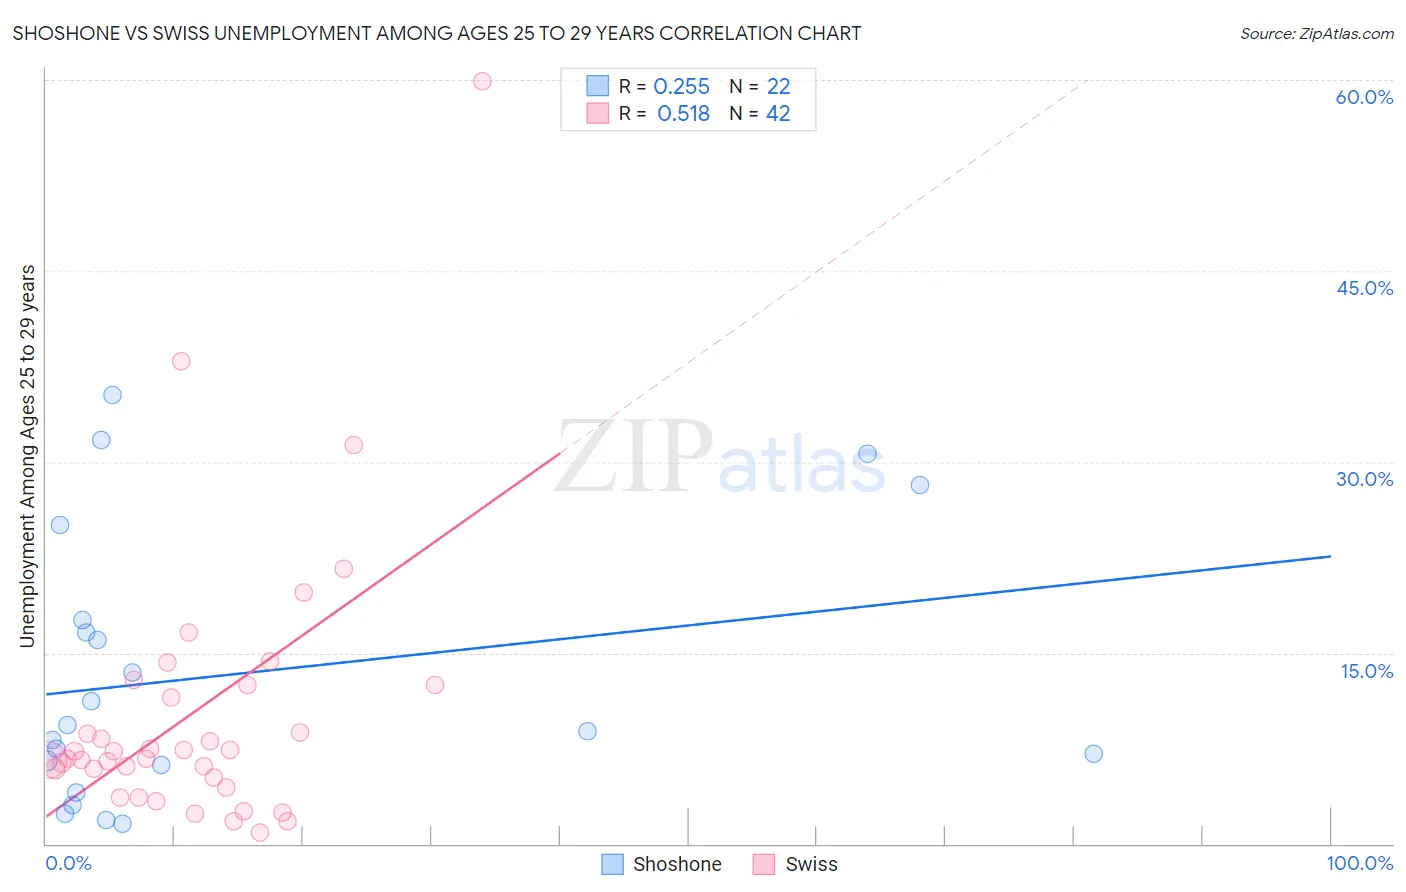
Shoshone vs Swiss Unemployment Among Ages 25 to 29 years Correlation Chart
The statistical analysis conducted on geographies consisting of 65,507,418 people shows a weak positive correlation between the proportion of Shoshone and unemployment rate among population between the ages 25 and 29 in the United States with a correlation coefficient (R) of 0.255 and weighted average of 9.2%. Similarly, the statistical analysis conducted on geographies consisting of 427,383,004 people shows a substantial positive correlation between the proportion of Swiss and unemployment rate among population between the ages 25 and 29 in the United States with a correlation coefficient (R) of 0.518 and weighted average of 6.4%, a difference of 43.3%.
Unemployment Among Ages 25 to 29 years Correlation Summary
| Measurement | Shoshone | Swiss |
| Minimum | 1.6% | 0.90% |
| Maximum | 35.2% | 59.9% |
| Range | 33.6% | 59.0% |
| Mean | 13.3% | 10.2% |
| Median | 9.1% | 7.0% |
| Interquartile 25% (IQ1) | 6.2% | 5.2% |
| Interquartile 75% (IQ3) | 17.6% | 12.5% |
| Interquartile Range (IQR) | 11.4% | 7.3% |
| Standard Deviation (Sample) | 10.5% | 10.8% |
| Standard Deviation (Population) | 10.3% | 10.7% |
Similar Demographics by Unemployment Among Ages 25 to 29 years
Demographics Similar to Shoshone by Unemployment Among Ages 25 to 29 years
In terms of unemployment among ages 25 to 29 years, the demographic groups most similar to Shoshone are Colville (9.2%, a difference of 0.16%), Apache (9.5%, a difference of 2.8%), Aleut (9.7%, a difference of 5.0%), Yakama (8.8%, a difference of 5.3%), and Houma (8.7%, a difference of 5.8%).
| Demographics | Rating | Rank | Unemployment Among Ages 25 to 29 years |
| Immigrants | Armenia | 0.0 /100 | #319 | Tragic 8.5% |
| Blacks/African Americans | 0.0 /100 | #320 | Tragic 8.6% |
| Immigrants | Dominican Republic | 0.0 /100 | #321 | Tragic 8.6% |
| Tlingit-Haida | 0.0 /100 | #322 | Tragic 8.7% |
| Dominicans | 0.0 /100 | #323 | Tragic 8.7% |
| Houma | 0.0 /100 | #324 | Tragic 8.7% |
| Yakama | 0.0 /100 | #325 | Tragic 8.8% |
| Shoshone | 0.0 /100 | #326 | Tragic 9.2% |
| Colville | 0.0 /100 | #327 | Tragic 9.2% |
| Apache | 0.0 /100 | #328 | Tragic 9.5% |
| Aleuts | 0.0 /100 | #329 | Tragic 9.7% |
| Natives/Alaskans | 0.0 /100 | #330 | Tragic 9.8% |
| Alaska Natives | 0.0 /100 | #331 | Tragic 10.2% |
| Pueblo | 0.0 /100 | #332 | Tragic 10.4% |
| Alaskan Athabascans | 0.0 /100 | #333 | Tragic 10.8% |
Demographics Similar to Swiss by Unemployment Among Ages 25 to 29 years
In terms of unemployment among ages 25 to 29 years, the demographic groups most similar to Swiss are Croatian (6.4%, a difference of 0.060%), Immigrants from Albania (6.4%, a difference of 0.10%), European (6.4%, a difference of 0.11%), Immigrants from Hungary (6.4%, a difference of 0.14%), and Immigrants from Colombia (6.4%, a difference of 0.15%).
| Demographics | Rating | Rank | Unemployment Among Ages 25 to 29 years |
| Uruguayans | 91.2 /100 | #100 | Exceptional 6.4% |
| Immigrants | Ireland | 91.1 /100 | #101 | Exceptional 6.4% |
| British | 90.5 /100 | #102 | Exceptional 6.4% |
| Immigrants | Congo | 90.4 /100 | #103 | Exceptional 6.4% |
| Cypriots | 90.1 /100 | #104 | Exceptional 6.4% |
| Immigrants | Kazakhstan | 89.8 /100 | #105 | Excellent 6.4% |
| Immigrants | Hungary | 89.4 /100 | #106 | Excellent 6.4% |
| Swiss | 88.6 /100 | #107 | Excellent 6.4% |
| Croatians | 88.2 /100 | #108 | Excellent 6.4% |
| Immigrants | Albania | 87.9 /100 | #109 | Excellent 6.4% |
| Europeans | 87.8 /100 | #110 | Excellent 6.4% |
| Immigrants | Colombia | 87.6 /100 | #111 | Excellent 6.4% |
| Immigrants | Nicaragua | 87.5 /100 | #112 | Excellent 6.4% |
| Immigrants | Egypt | 87.1 /100 | #113 | Excellent 6.5% |
| Germans | 86.3 /100 | #114 | Excellent 6.5% |