Subsaharan African vs Uruguayan Disability Age 18 to 34
COMPARE
Subsaharan African
Uruguayan
Disability Age 18 to 34
Disability Age 18 to 34 Comparison
Sub-Saharan Africans
Uruguayans
7.1%
DISABILITY AGE 18 TO 34
1.7/ 100
METRIC RATING
235th/ 347
METRIC RANK
6.2%
DISABILITY AGE 18 TO 34
97.3/ 100
METRIC RATING
97th/ 347
METRIC RANK
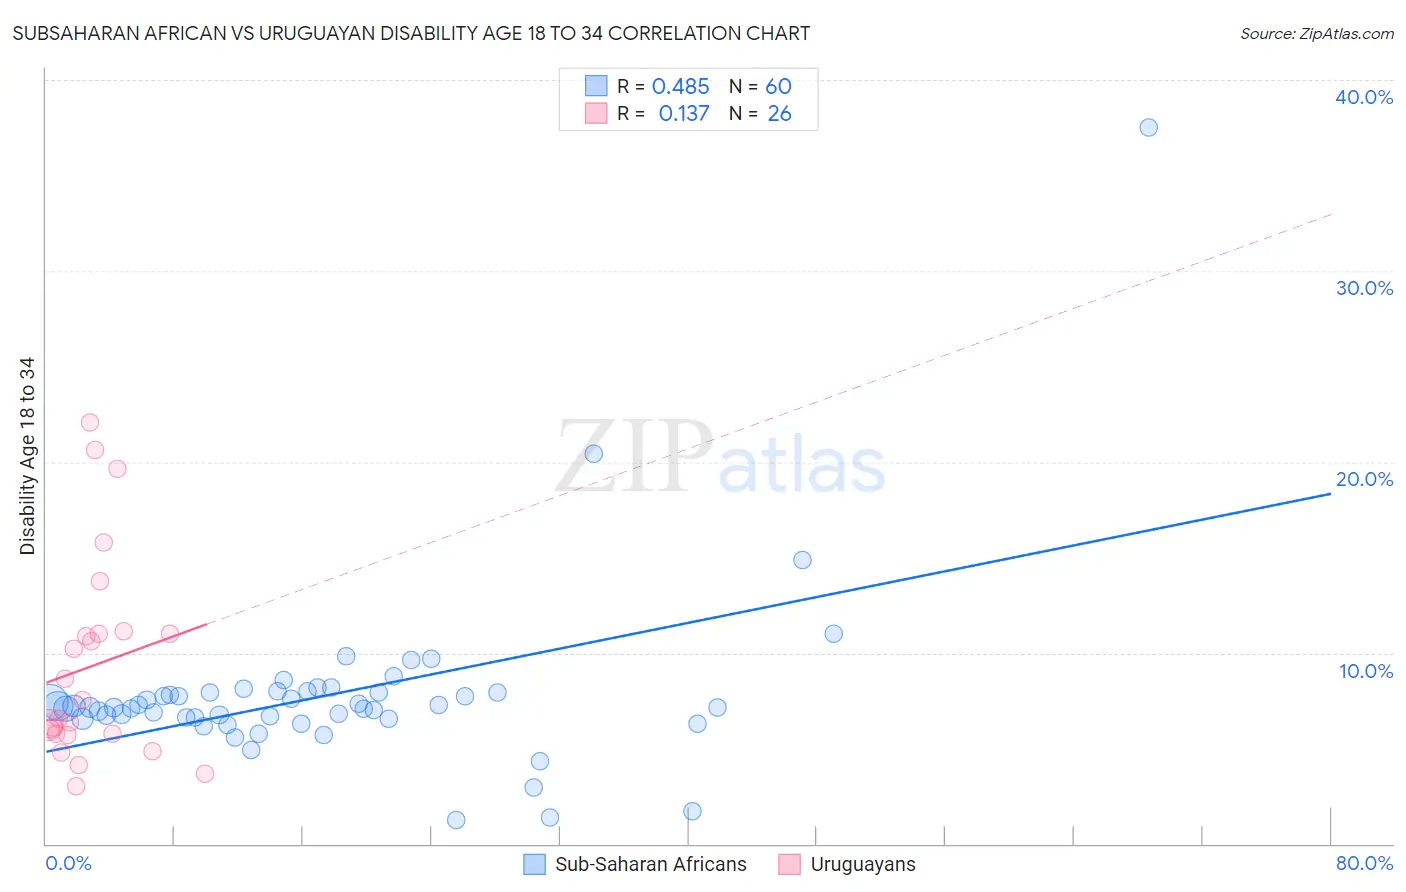
Subsaharan African vs Uruguayan Disability Age 18 to 34 Correlation Chart
The statistical analysis conducted on geographies consisting of 506,334,183 people shows a moderate positive correlation between the proportion of Sub-Saharan Africans and percentage of population with a disability between the ages 18 and 35 in the United States with a correlation coefficient (R) of 0.485 and weighted average of 7.1%. Similarly, the statistical analysis conducted on geographies consisting of 144,733,495 people shows a poor positive correlation between the proportion of Uruguayans and percentage of population with a disability between the ages 18 and 35 in the United States with a correlation coefficient (R) of 0.137 and weighted average of 6.2%, a difference of 14.1%.
Disability Age 18 to 34 Correlation Summary
| Measurement | Subsaharan African | Uruguayan |
| Minimum | 1.2% | 3.0% |
| Maximum | 37.5% | 22.1% |
| Range | 36.3% | 19.0% |
| Mean | 7.8% | 9.3% |
| Median | 7.1% | 7.0% |
| Interquartile 25% (IQ1) | 6.6% | 5.8% |
| Interquartile 75% (IQ3) | 7.9% | 11.0% |
| Interquartile Range (IQR) | 1.4% | 5.2% |
| Standard Deviation (Sample) | 4.7% | 5.3% |
| Standard Deviation (Population) | 4.7% | 5.2% |
Similar Demographics by Disability Age 18 to 34
Demographics Similar to Sub-Saharan Africans by Disability Age 18 to 34
In terms of disability age 18 to 34, the demographic groups most similar to Sub-Saharan Africans are Liberian (7.1%, a difference of 0.25%), Alsatian (7.0%, a difference of 0.37%), Austrian (7.1%, a difference of 0.42%), Marshallese (7.1%, a difference of 0.47%), and Italian (7.1%, a difference of 0.58%).
| Demographics | Rating | Rank | Disability Age 18 to 34 |
| Immigrants | Yemen | 4.2 /100 | #228 | Tragic 7.0% |
| Lithuanians | 4.1 /100 | #229 | Tragic 7.0% |
| Immigrants | North America | 3.9 /100 | #230 | Tragic 7.0% |
| Ute | 3.8 /100 | #231 | Tragic 7.0% |
| Samoans | 3.2 /100 | #232 | Tragic 7.0% |
| New Zealanders | 2.7 /100 | #233 | Tragic 7.0% |
| Alsatians | 2.1 /100 | #234 | Tragic 7.0% |
| Sub-Saharan Africans | 1.7 /100 | #235 | Tragic 7.1% |
| Liberians | 1.5 /100 | #236 | Tragic 7.1% |
| Austrians | 1.3 /100 | #237 | Tragic 7.1% |
| Marshallese | 1.3 /100 | #238 | Tragic 7.1% |
| Italians | 1.2 /100 | #239 | Tragic 7.1% |
| Arapaho | 1.1 /100 | #240 | Tragic 7.1% |
| Nepalese | 1.1 /100 | #241 | Tragic 7.1% |
| Immigrants | Congo | 1.1 /100 | #242 | Tragic 7.1% |
Demographics Similar to Uruguayans by Disability Age 18 to 34
In terms of disability age 18 to 34, the demographic groups most similar to Uruguayans are Immigrants from Syria (6.2%, a difference of 0.040%), Immigrants from Uruguay (6.2%, a difference of 0.080%), Central American (6.2%, a difference of 0.13%), Immigrants from Kazakhstan (6.2%, a difference of 0.16%), and Immigrants (6.2%, a difference of 0.21%).
| Demographics | Rating | Rank | Disability Age 18 to 34 |
| Immigrants | Vietnam | 97.7 /100 | #90 | Exceptional 6.2% |
| Immigrants | Philippines | 97.6 /100 | #91 | Exceptional 6.2% |
| Jordanians | 97.6 /100 | #92 | Exceptional 6.2% |
| Immigrants | Immigrants | 97.6 /100 | #93 | Exceptional 6.2% |
| Immigrants | Kazakhstan | 97.5 /100 | #94 | Exceptional 6.2% |
| Central Americans | 97.5 /100 | #95 | Exceptional 6.2% |
| Immigrants | Uruguay | 97.4 /100 | #96 | Exceptional 6.2% |
| Uruguayans | 97.3 /100 | #97 | Exceptional 6.2% |
| Immigrants | Syria | 97.2 /100 | #98 | Exceptional 6.2% |
| Immigrants | Ethiopia | 96.9 /100 | #99 | Exceptional 6.2% |
| Immigrants | Albania | 96.7 /100 | #100 | Exceptional 6.2% |
| Immigrants | Jamaica | 96.4 /100 | #101 | Exceptional 6.2% |
| Laotians | 96.4 /100 | #102 | Exceptional 6.2% |
| Immigrants | Bulgaria | 96.3 /100 | #103 | Exceptional 6.2% |
| Mongolians | 96.2 /100 | #104 | Exceptional 6.2% |