Scotch-Irish vs Scottish Disability Age Under 5
COMPARE
Scotch-Irish
Scottish
Disability Age Under 5
Disability Age Under 5 Comparison
Scotch-Irish
Scottish
1.7%
DISABILITY AGE UNDER 5
0.0/ 100
METRIC RATING
320th/ 347
METRIC RANK
1.6%
DISABILITY AGE UNDER 5
0.0/ 100
METRIC RATING
307th/ 347
METRIC RANK
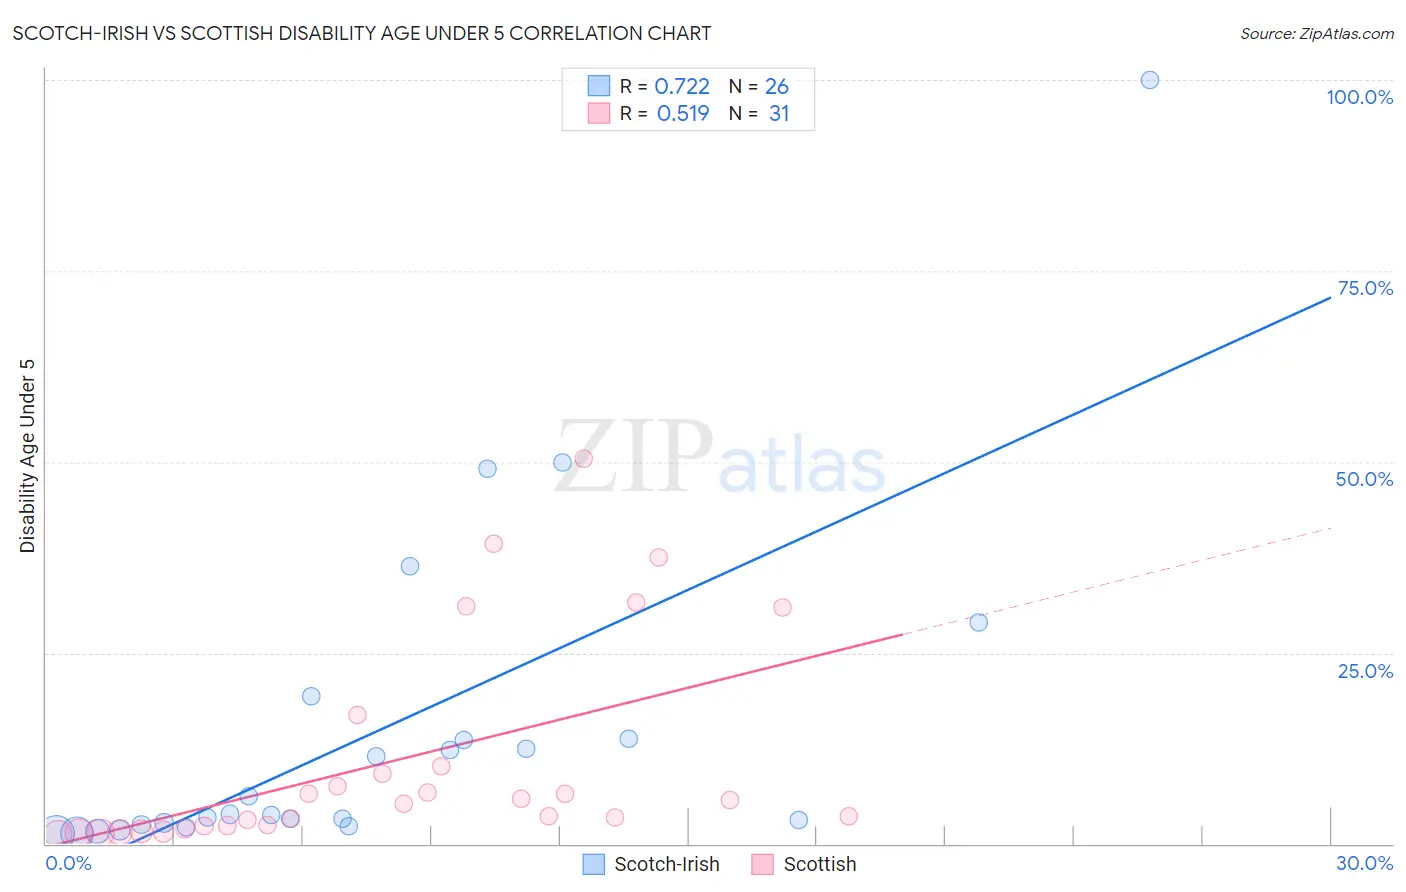
Scotch-Irish vs Scottish Disability Age Under 5 Correlation Chart
The statistical analysis conducted on geographies consisting of 253,637,747 people shows a strong positive correlation between the proportion of Scotch-Irish and percentage of population with a disability under the age of 5 in the United States with a correlation coefficient (R) of 0.722 and weighted average of 1.7%. Similarly, the statistical analysis conducted on geographies consisting of 258,599,259 people shows a substantial positive correlation between the proportion of Scottish and percentage of population with a disability under the age of 5 in the United States with a correlation coefficient (R) of 0.519 and weighted average of 1.6%, a difference of 3.8%.
Disability Age Under 5 Correlation Summary
| Measurement | Scotch-Irish | Scottish |
| Minimum | 1.3% | 1.4% |
| Maximum | 100.0% | 50.4% |
| Range | 98.7% | 49.0% |
| Mean | 15.0% | 10.8% |
| Median | 3.8% | 5.3% |
| Interquartile 25% (IQ1) | 2.5% | 2.3% |
| Interquartile 75% (IQ3) | 13.7% | 10.1% |
| Interquartile Range (IQR) | 11.1% | 7.8% |
| Standard Deviation (Sample) | 22.4% | 13.7% |
| Standard Deviation (Population) | 22.0% | 13.4% |
Demographics Similar to Scotch-Irish and Scottish by Disability Age Under 5
In terms of disability age under 5, the demographic groups most similar to Scotch-Irish are Ottawa (1.7%, a difference of 0.060%), Slovak (1.7%, a difference of 0.53%), German (1.7%, a difference of 0.63%), Irish (1.7%, a difference of 0.84%), and French (1.7%, a difference of 1.1%). Similarly, the demographic groups most similar to Scottish are Creek (1.6%, a difference of 0.070%), Blackfeet (1.6%, a difference of 0.10%), Navajo (1.6%, a difference of 0.14%), Seminole (1.6%, a difference of 0.26%), and Cape Verdean (1.7%, a difference of 0.77%).
| Demographics | Rating | Rank | Disability Age Under 5 |
| Swiss | 0.0 /100 | #303 | Tragic 1.6% |
| Seminole | 0.0 /100 | #304 | Tragic 1.6% |
| Blackfeet | 0.0 /100 | #305 | Tragic 1.6% |
| Creek | 0.0 /100 | #306 | Tragic 1.6% |
| Scottish | 0.0 /100 | #307 | Tragic 1.6% |
| Navajo | 0.0 /100 | #308 | Tragic 1.6% |
| Cape Verdeans | 0.0 /100 | #309 | Tragic 1.7% |
| Whites/Caucasians | 0.0 /100 | #310 | Tragic 1.7% |
| English | 0.0 /100 | #311 | Tragic 1.7% |
| Puerto Ricans | 0.0 /100 | #312 | Tragic 1.7% |
| Celtics | 0.0 /100 | #313 | Tragic 1.7% |
| Norwegians | 0.0 /100 | #314 | Tragic 1.7% |
| Dutch | 0.0 /100 | #315 | Tragic 1.7% |
| Immigrants | Cabo Verde | 0.0 /100 | #316 | Tragic 1.7% |
| French | 0.0 /100 | #317 | Tragic 1.7% |
| Irish | 0.0 /100 | #318 | Tragic 1.7% |
| Slovaks | 0.0 /100 | #319 | Tragic 1.7% |
| Scotch-Irish | 0.0 /100 | #320 | Tragic 1.7% |
| Ottawa | 0.0 /100 | #321 | Tragic 1.7% |
| Germans | 0.0 /100 | #322 | Tragic 1.7% |
| Chickasaw | 0.0 /100 | #323 | Tragic 1.7% |