Scotch-Irish vs Scottish No Schooling Completed
COMPARE
Scotch-Irish
Scottish
No Schooling Completed
No Schooling Completed Comparison
Scotch-Irish
Scottish
1.5%
NO SCHOOLING COMPLETED
100.0/ 100
METRIC RATING
14th/ 347
METRIC RANK
1.4%
NO SCHOOLING COMPLETED
100.0/ 100
METRIC RATING
9th/ 347
METRIC RANK
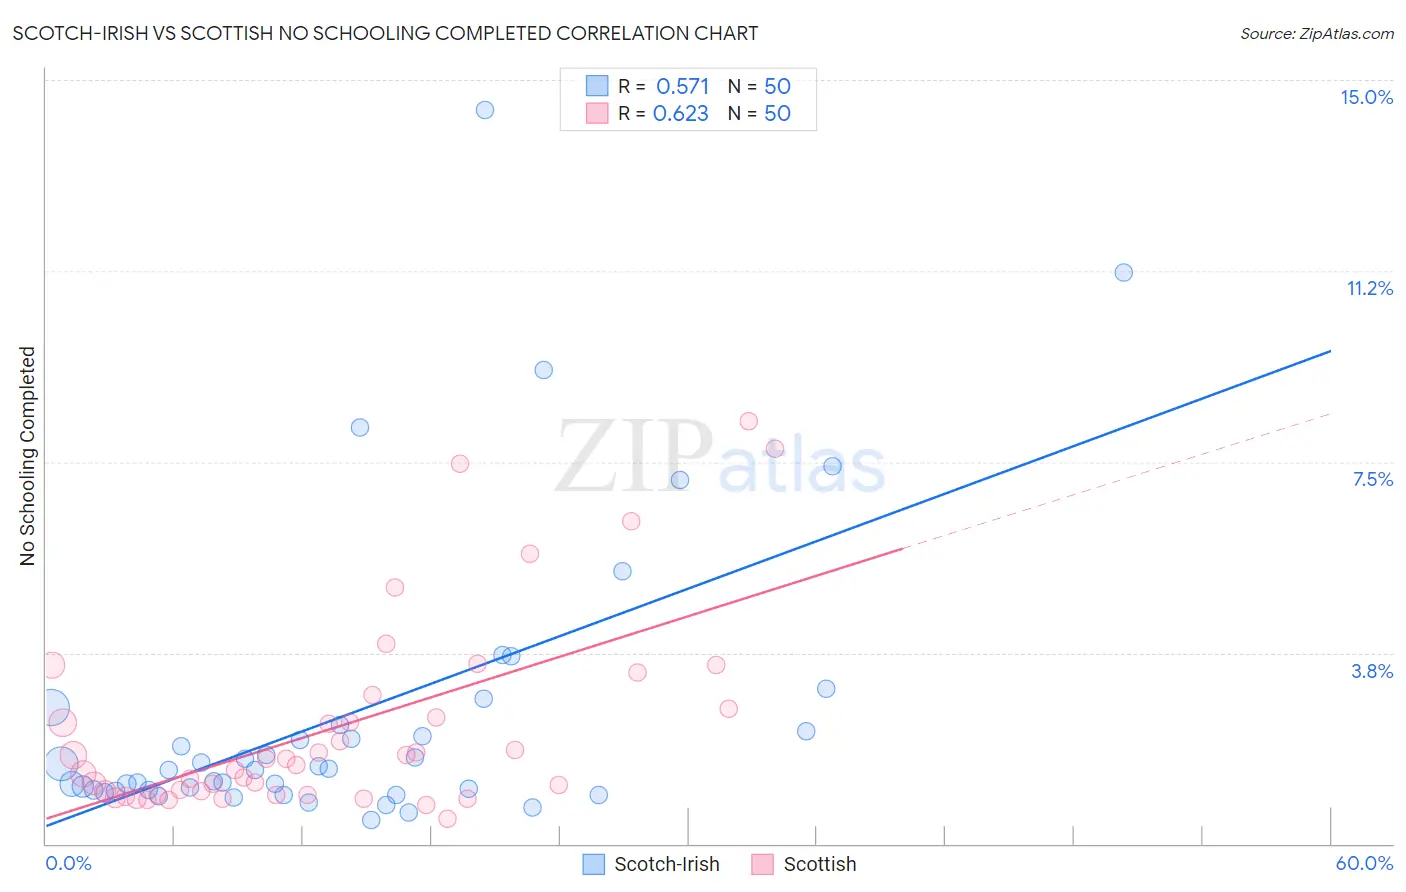
Scotch-Irish vs Scottish No Schooling Completed Correlation Chart
The statistical analysis conducted on geographies consisting of 532,641,930 people shows a substantial positive correlation between the proportion of Scotch-Irish and percentage of population with no schooling in the United States with a correlation coefficient (R) of 0.571 and weighted average of 1.5%. Similarly, the statistical analysis conducted on geographies consisting of 548,415,962 people shows a significant positive correlation between the proportion of Scottish and percentage of population with no schooling in the United States with a correlation coefficient (R) of 0.623 and weighted average of 1.4%, a difference of 2.6%.
No Schooling Completed Correlation Summary
| Measurement | Scotch-Irish | Scottish |
| Minimum | 0.46% | 0.50% |
| Maximum | 14.4% | 8.3% |
| Range | 14.0% | 7.8% |
| Mean | 2.6% | 2.3% |
| Median | 1.5% | 1.6% |
| Interquartile 25% (IQ1) | 1.0% | 0.97% |
| Interquartile 75% (IQ3) | 2.3% | 2.7% |
| Interquartile Range (IQR) | 1.3% | 1.7% |
| Standard Deviation (Sample) | 2.9% | 1.9% |
| Standard Deviation (Population) | 2.9% | 1.9% |
Demographics Similar to Scotch-Irish and Scottish by No Schooling Completed
In terms of no schooling completed, the demographic groups most similar to Scotch-Irish are Tlingit-Haida (1.5%, a difference of 0.060%), Finnish (1.5%, a difference of 0.58%), Croatian (1.5%, a difference of 0.59%), Danish (1.5%, a difference of 0.89%), and Polish (1.4%, a difference of 0.94%). Similarly, the demographic groups most similar to Scottish are Swedish (1.4%, a difference of 0.53%), Dutch (1.4%, a difference of 0.80%), Lithuanian (1.4%, a difference of 1.6%), Irish (1.4%, a difference of 1.7%), and Polish (1.4%, a difference of 1.7%).
| Demographics | Rating | Rank | No Schooling Completed |
| Yup'ik | 100.0 /100 | #1 | Exceptional 1.2% |
| Slovaks | 100.0 /100 | #2 | Exceptional 1.3% |
| Norwegians | 100.0 /100 | #3 | Exceptional 1.3% |
| Germans | 100.0 /100 | #4 | Exceptional 1.4% |
| Slovenes | 100.0 /100 | #5 | Exceptional 1.4% |
| Carpatho Rusyns | 100.0 /100 | #6 | Exceptional 1.4% |
| English | 100.0 /100 | #7 | Exceptional 1.4% |
| Swedes | 100.0 /100 | #8 | Exceptional 1.4% |
| Scottish | 100.0 /100 | #9 | Exceptional 1.4% |
| Dutch | 100.0 /100 | #10 | Exceptional 1.4% |
| Lithuanians | 100.0 /100 | #11 | Exceptional 1.4% |
| Irish | 100.0 /100 | #12 | Exceptional 1.4% |
| Poles | 100.0 /100 | #13 | Exceptional 1.4% |
| Scotch-Irish | 100.0 /100 | #14 | Exceptional 1.5% |
| Tlingit-Haida | 100.0 /100 | #15 | Exceptional 1.5% |
| Finns | 100.0 /100 | #16 | Exceptional 1.5% |
| Croatians | 100.0 /100 | #17 | Exceptional 1.5% |
| Danes | 100.0 /100 | #18 | Exceptional 1.5% |
| Alaskan Athabascans | 100.0 /100 | #19 | Exceptional 1.5% |
| Welsh | 100.0 /100 | #20 | Exceptional 1.5% |
| Chinese | 100.0 /100 | #21 | Exceptional 1.5% |