Scotch-Irish vs British Disability Age Under 5
COMPARE
Scotch-Irish
British
Disability Age Under 5
Disability Age Under 5 Comparison
Scotch-Irish
British
1.7%
DISABILITY AGE UNDER 5
0.0/ 100
METRIC RATING
320th/ 347
METRIC RANK
1.5%
DISABILITY AGE UNDER 5
0.0/ 100
METRIC RATING
280th/ 347
METRIC RANK
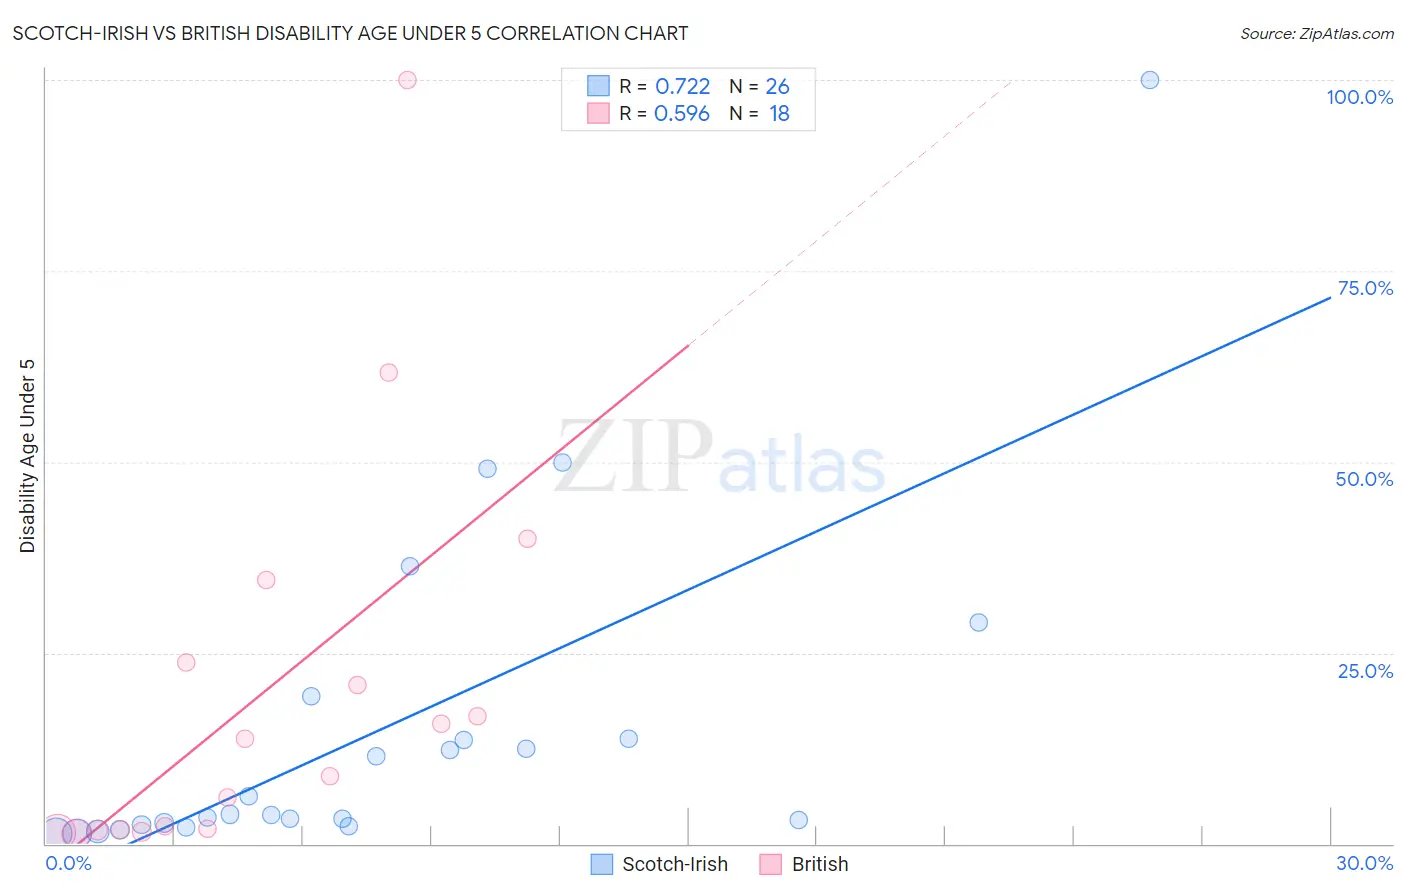
Scotch-Irish vs British Disability Age Under 5 Correlation Chart
The statistical analysis conducted on geographies consisting of 253,637,747 people shows a strong positive correlation between the proportion of Scotch-Irish and percentage of population with a disability under the age of 5 in the United States with a correlation coefficient (R) of 0.722 and weighted average of 1.7%. Similarly, the statistical analysis conducted on geographies consisting of 252,245,958 people shows a substantial positive correlation between the proportion of British and percentage of population with a disability under the age of 5 in the United States with a correlation coefficient (R) of 0.596 and weighted average of 1.5%, a difference of 15.0%.
Disability Age Under 5 Correlation Summary
| Measurement | Scotch-Irish | British |
| Minimum | 1.3% | 1.3% |
| Maximum | 100.0% | 100.0% |
| Range | 98.7% | 98.7% |
| Mean | 15.0% | 19.7% |
| Median | 3.8% | 11.3% |
| Interquartile 25% (IQ1) | 2.5% | 1.8% |
| Interquartile 75% (IQ3) | 13.7% | 23.7% |
| Interquartile Range (IQR) | 11.1% | 21.9% |
| Standard Deviation (Sample) | 22.4% | 26.0% |
| Standard Deviation (Population) | 22.0% | 25.3% |
Similar Demographics by Disability Age Under 5
Demographics Similar to Scotch-Irish by Disability Age Under 5
In terms of disability age under 5, the demographic groups most similar to Scotch-Irish are Ottawa (1.7%, a difference of 0.060%), Slovak (1.7%, a difference of 0.53%), German (1.7%, a difference of 0.63%), Irish (1.7%, a difference of 0.84%), and French (1.7%, a difference of 1.1%).
| Demographics | Rating | Rank | Disability Age Under 5 |
| Celtics | 0.0 /100 | #313 | Tragic 1.7% |
| Norwegians | 0.0 /100 | #314 | Tragic 1.7% |
| Dutch | 0.0 /100 | #315 | Tragic 1.7% |
| Immigrants | Cabo Verde | 0.0 /100 | #316 | Tragic 1.7% |
| French | 0.0 /100 | #317 | Tragic 1.7% |
| Irish | 0.0 /100 | #318 | Tragic 1.7% |
| Slovaks | 0.0 /100 | #319 | Tragic 1.7% |
| Scotch-Irish | 0.0 /100 | #320 | Tragic 1.7% |
| Ottawa | 0.0 /100 | #321 | Tragic 1.7% |
| Germans | 0.0 /100 | #322 | Tragic 1.7% |
| Chickasaw | 0.0 /100 | #323 | Tragic 1.7% |
| Cherokee | 0.0 /100 | #324 | Tragic 1.8% |
| Immigrants | Portugal | 0.0 /100 | #325 | Tragic 1.8% |
| Sioux | 0.0 /100 | #326 | Tragic 1.8% |
| Osage | 0.0 /100 | #327 | Tragic 1.8% |
Demographics Similar to British by Disability Age Under 5
In terms of disability age under 5, the demographic groups most similar to British are Danish (1.5%, a difference of 0.76%), Kiowa (1.5%, a difference of 0.77%), Canadian (1.5%, a difference of 0.85%), Greek (1.5%, a difference of 1.6%), and Czechoslovakian (1.5%, a difference of 1.7%).
| Demographics | Rating | Rank | Disability Age Under 5 |
| Alaskan Athabascans | 0.1 /100 | #273 | Tragic 1.5% |
| Iroquois | 0.0 /100 | #274 | Tragic 1.5% |
| Brazilians | 0.0 /100 | #275 | Tragic 1.5% |
| Greeks | 0.0 /100 | #276 | Tragic 1.5% |
| Canadians | 0.0 /100 | #277 | Tragic 1.5% |
| Kiowa | 0.0 /100 | #278 | Tragic 1.5% |
| Danes | 0.0 /100 | #279 | Tragic 1.5% |
| British | 0.0 /100 | #280 | Tragic 1.5% |
| Czechoslovakians | 0.0 /100 | #281 | Tragic 1.5% |
| Cheyenne | 0.0 /100 | #282 | Tragic 1.5% |
| Delaware | 0.0 /100 | #283 | Tragic 1.5% |
| Europeans | 0.0 /100 | #284 | Tragic 1.5% |
| Croatians | 0.0 /100 | #285 | Tragic 1.5% |
| Tlingit-Haida | 0.0 /100 | #286 | Tragic 1.5% |
| Scandinavians | 0.0 /100 | #287 | Tragic 1.5% |