Scotch-Irish vs Scottish College, 1 year or more
COMPARE
Scotch-Irish
Scottish
College, 1 year or more
College, 1 year or more Comparison
Scotch-Irish
Scottish
58.9%
COLLEGE, 1 YEAR OR MORE
34.7/ 100
METRIC RATING
186th/ 347
METRIC RANK
60.5%
COLLEGE, 1 YEAR OR MORE
80.2/ 100
METRIC RATING
146th/ 347
METRIC RANK
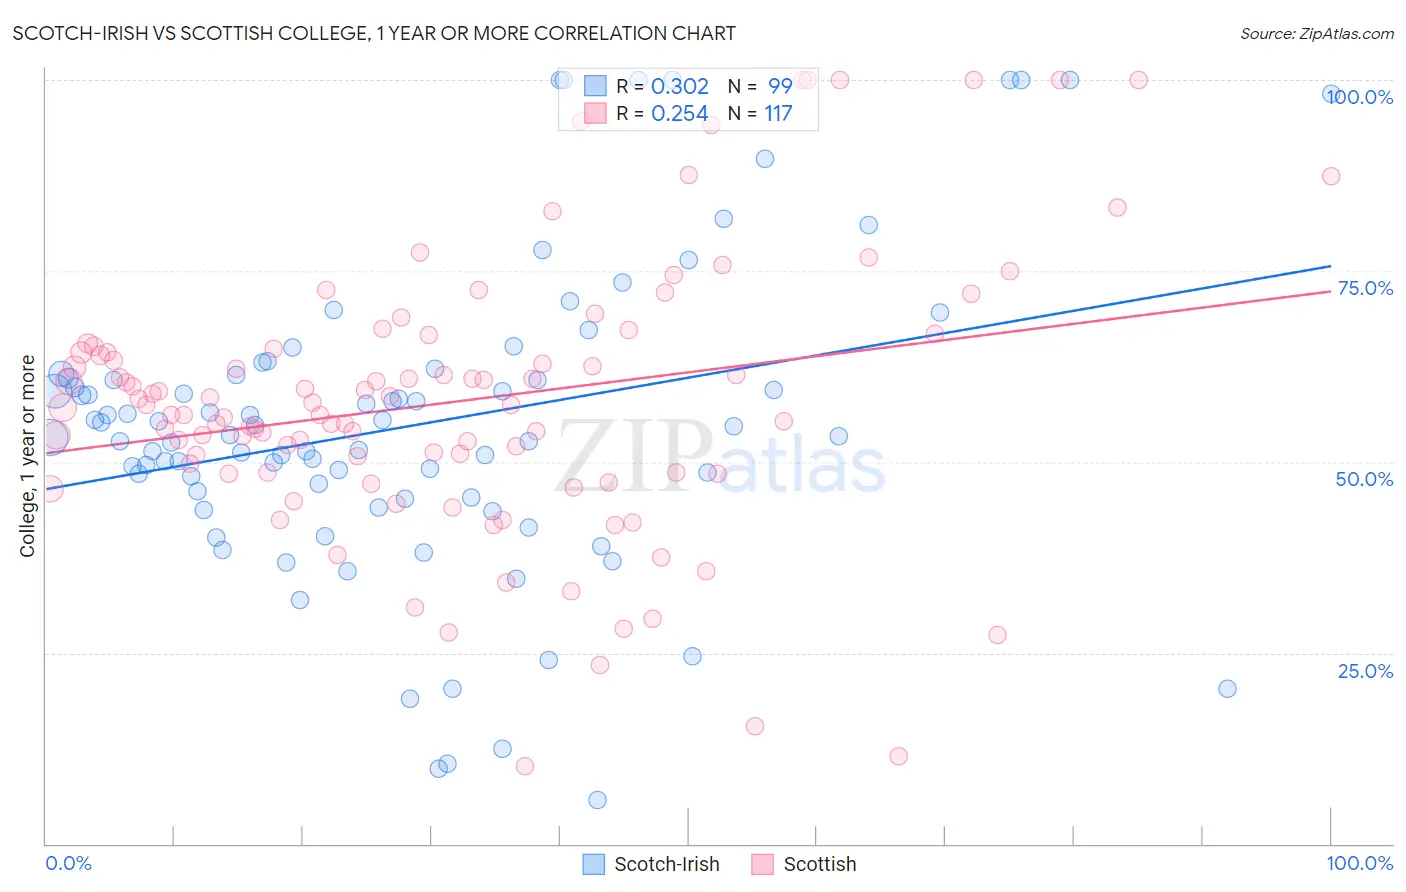
Scotch-Irish vs Scottish College, 1 year or more Correlation Chart
The statistical analysis conducted on geographies consisting of 548,772,919 people shows a mild positive correlation between the proportion of Scotch-Irish and percentage of population with at least college, 1 year or more education in the United States with a correlation coefficient (R) of 0.302 and weighted average of 58.9%. Similarly, the statistical analysis conducted on geographies consisting of 567,133,506 people shows a weak positive correlation between the proportion of Scottish and percentage of population with at least college, 1 year or more education in the United States with a correlation coefficient (R) of 0.254 and weighted average of 60.5%, a difference of 2.7%.
College, 1 year or more Correlation Summary
| Measurement | Scotch-Irish | Scottish |
| Minimum | 5.7% | 10.1% |
| Maximum | 100.0% | 100.0% |
| Range | 94.3% | 89.9% |
| Mean | 54.8% | 57.9% |
| Median | 53.5% | 57.5% |
| Interquartile 25% (IQ1) | 45.3% | 48.7% |
| Interquartile 75% (IQ3) | 61.3% | 65.0% |
| Interquartile Range (IQR) | 16.0% | 16.3% |
| Standard Deviation (Sample) | 20.2% | 17.9% |
| Standard Deviation (Population) | 20.1% | 17.8% |
Similar Demographics by College, 1 year or more
Demographics Similar to Scotch-Irish by College, 1 year or more
In terms of college, 1 year or more, the demographic groups most similar to Scotch-Irish are German (58.9%, a difference of 0.0%), French (58.9%, a difference of 0.020%), South American (59.0%, a difference of 0.070%), Uruguayan (58.8%, a difference of 0.18%), and Spaniard (59.0%, a difference of 0.21%).
| Demographics | Rating | Rank | College, 1 year or more |
| Bermudans | 46.6 /100 | #179 | Average 59.3% |
| Yugoslavians | 44.1 /100 | #180 | Average 59.2% |
| Swiss | 43.4 /100 | #181 | Average 59.2% |
| Immigrants | Bosnia and Herzegovina | 42.8 /100 | #182 | Average 59.2% |
| German Russians | 39.3 /100 | #183 | Fair 59.1% |
| Spaniards | 38.3 /100 | #184 | Fair 59.0% |
| South Americans | 35.9 /100 | #185 | Fair 59.0% |
| Scotch-Irish | 34.7 /100 | #186 | Fair 58.9% |
| Germans | 34.7 /100 | #187 | Fair 58.9% |
| French | 34.4 /100 | #188 | Fair 58.9% |
| Uruguayans | 31.8 /100 | #189 | Fair 58.8% |
| Immigrants | Cameroon | 31.2 /100 | #190 | Fair 58.8% |
| Immigrants | Philippines | 29.2 /100 | #191 | Fair 58.7% |
| Colombians | 27.6 /100 | #192 | Fair 58.7% |
| Peruvians | 27.5 /100 | #193 | Fair 58.6% |
Demographics Similar to Scottish by College, 1 year or more
In terms of college, 1 year or more, the demographic groups most similar to Scottish are Slavic (60.6%, a difference of 0.070%), Immigrants from Kenya (60.5%, a difference of 0.090%), Kenyan (60.5%, a difference of 0.10%), Brazilian (60.5%, a difference of 0.10%), and Czech (60.6%, a difference of 0.14%).
| Demographics | Rating | Rank | College, 1 year or more |
| Immigrants | Eritrea | 84.3 /100 | #139 | Excellent 60.7% |
| Iraqis | 83.3 /100 | #140 | Excellent 60.7% |
| Immigrants | Afghanistan | 83.1 /100 | #141 | Excellent 60.7% |
| Poles | 82.8 /100 | #142 | Excellent 60.7% |
| Canadians | 82.7 /100 | #143 | Excellent 60.6% |
| Czechs | 81.9 /100 | #144 | Excellent 60.6% |
| Slavs | 81.1 /100 | #145 | Excellent 60.6% |
| Scottish | 80.2 /100 | #146 | Excellent 60.5% |
| Immigrants | Kenya | 79.1 /100 | #147 | Good 60.5% |
| Kenyans | 79.0 /100 | #148 | Good 60.5% |
| Brazilians | 79.0 /100 | #149 | Good 60.5% |
| Immigrants | Sudan | 77.8 /100 | #150 | Good 60.4% |
| Albanians | 77.8 /100 | #151 | Good 60.4% |
| Immigrants | Germany | 76.1 /100 | #152 | Good 60.3% |
| Sierra Leoneans | 74.1 /100 | #153 | Good 60.2% |