Black/African American vs Scottish Disability Age Under 5
COMPARE
Black/African American
Scottish
Disability Age Under 5
Disability Age Under 5 Comparison
Blacks/African Americans
Scottish
1.4%
DISABILITY AGE UNDER 5
0.1/ 100
METRIC RATING
272nd/ 347
METRIC RANK
1.6%
DISABILITY AGE UNDER 5
0.0/ 100
METRIC RATING
307th/ 347
METRIC RANK
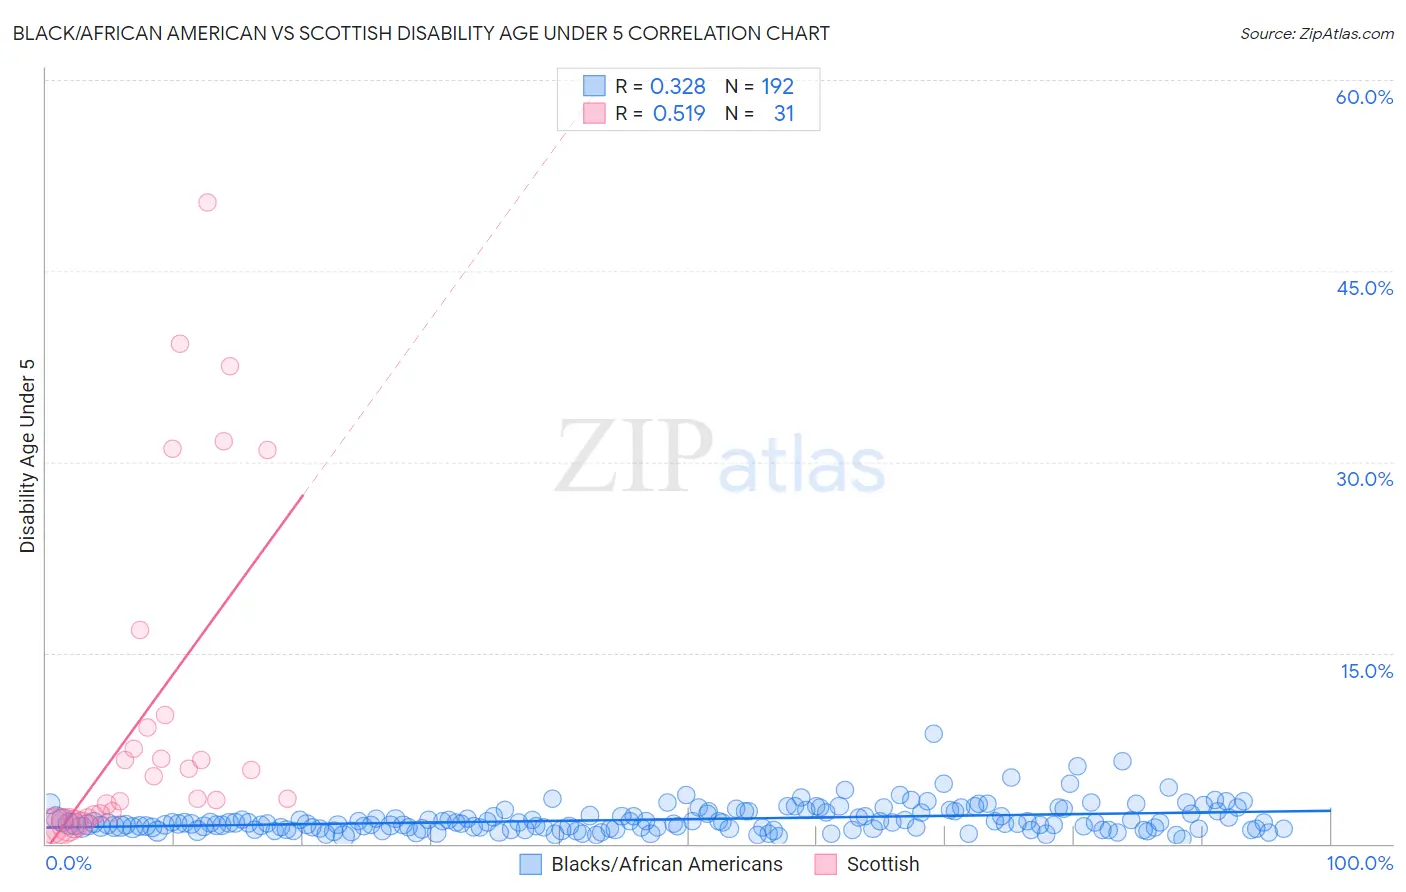
Black/African American vs Scottish Disability Age Under 5 Correlation Chart
The statistical analysis conducted on geographies consisting of 261,159,636 people shows a mild positive correlation between the proportion of Blacks/African Americans and percentage of population with a disability under the age of 5 in the United States with a correlation coefficient (R) of 0.328 and weighted average of 1.4%. Similarly, the statistical analysis conducted on geographies consisting of 258,599,259 people shows a substantial positive correlation between the proportion of Scottish and percentage of population with a disability under the age of 5 in the United States with a correlation coefficient (R) of 0.519 and weighted average of 1.6%, a difference of 13.9%.
Disability Age Under 5 Correlation Summary
| Measurement | Black/African American | Scottish |
| Minimum | 0.43% | 1.4% |
| Maximum | 8.7% | 50.4% |
| Range | 8.2% | 49.0% |
| Mean | 1.9% | 10.8% |
| Median | 1.6% | 5.3% |
| Interquartile 25% (IQ1) | 1.2% | 2.3% |
| Interquartile 75% (IQ3) | 2.4% | 10.1% |
| Interquartile Range (IQR) | 1.2% | 7.8% |
| Standard Deviation (Sample) | 1.1% | 13.7% |
| Standard Deviation (Population) | 1.1% | 13.4% |
Similar Demographics by Disability Age Under 5
Demographics Similar to Blacks/African Americans by Disability Age Under 5
In terms of disability age under 5, the demographic groups most similar to Blacks/African Americans are Immigrants from Canada (1.4%, a difference of 0.16%), Immigrants from North America (1.4%, a difference of 0.20%), Alaskan Athabascan (1.5%, a difference of 0.29%), Austrian (1.4%, a difference of 0.33%), and Belgian (1.4%, a difference of 0.51%).
| Demographics | Rating | Rank | Disability Age Under 5 |
| Carpatho Rusyns | 0.1 /100 | #265 | Tragic 1.4% |
| Immigrants | Germany | 0.1 /100 | #266 | Tragic 1.4% |
| Cree | 0.1 /100 | #267 | Tragic 1.4% |
| Belgians | 0.1 /100 | #268 | Tragic 1.4% |
| Austrians | 0.1 /100 | #269 | Tragic 1.4% |
| Immigrants | North America | 0.1 /100 | #270 | Tragic 1.4% |
| Immigrants | Canada | 0.1 /100 | #271 | Tragic 1.4% |
| Blacks/African Americans | 0.1 /100 | #272 | Tragic 1.4% |
| Alaskan Athabascans | 0.1 /100 | #273 | Tragic 1.5% |
| Iroquois | 0.0 /100 | #274 | Tragic 1.5% |
| Brazilians | 0.0 /100 | #275 | Tragic 1.5% |
| Greeks | 0.0 /100 | #276 | Tragic 1.5% |
| Canadians | 0.0 /100 | #277 | Tragic 1.5% |
| Kiowa | 0.0 /100 | #278 | Tragic 1.5% |
| Danes | 0.0 /100 | #279 | Tragic 1.5% |
Demographics Similar to Scottish by Disability Age Under 5
In terms of disability age under 5, the demographic groups most similar to Scottish are Creek (1.6%, a difference of 0.070%), Blackfeet (1.6%, a difference of 0.10%), Navajo (1.6%, a difference of 0.14%), Seminole (1.6%, a difference of 0.26%), and Cape Verdean (1.7%, a difference of 0.77%).
| Demographics | Rating | Rank | Disability Age Under 5 |
| Shoshone | 0.0 /100 | #300 | Tragic 1.6% |
| German Russians | 0.0 /100 | #301 | Tragic 1.6% |
| Welsh | 0.0 /100 | #302 | Tragic 1.6% |
| Swiss | 0.0 /100 | #303 | Tragic 1.6% |
| Seminole | 0.0 /100 | #304 | Tragic 1.6% |
| Blackfeet | 0.0 /100 | #305 | Tragic 1.6% |
| Creek | 0.0 /100 | #306 | Tragic 1.6% |
| Scottish | 0.0 /100 | #307 | Tragic 1.6% |
| Navajo | 0.0 /100 | #308 | Tragic 1.6% |
| Cape Verdeans | 0.0 /100 | #309 | Tragic 1.7% |
| Whites/Caucasians | 0.0 /100 | #310 | Tragic 1.7% |
| English | 0.0 /100 | #311 | Tragic 1.7% |
| Puerto Ricans | 0.0 /100 | #312 | Tragic 1.7% |
| Celtics | 0.0 /100 | #313 | Tragic 1.7% |
| Norwegians | 0.0 /100 | #314 | Tragic 1.7% |