Malaysian vs Scottish Disability Age Under 5
COMPARE
Malaysian
Scottish
Disability Age Under 5
Disability Age Under 5 Comparison
Malaysians
Scottish
1.3%
DISABILITY AGE UNDER 5
13.2/ 100
METRIC RATING
218th/ 347
METRIC RANK
1.6%
DISABILITY AGE UNDER 5
0.0/ 100
METRIC RATING
307th/ 347
METRIC RANK
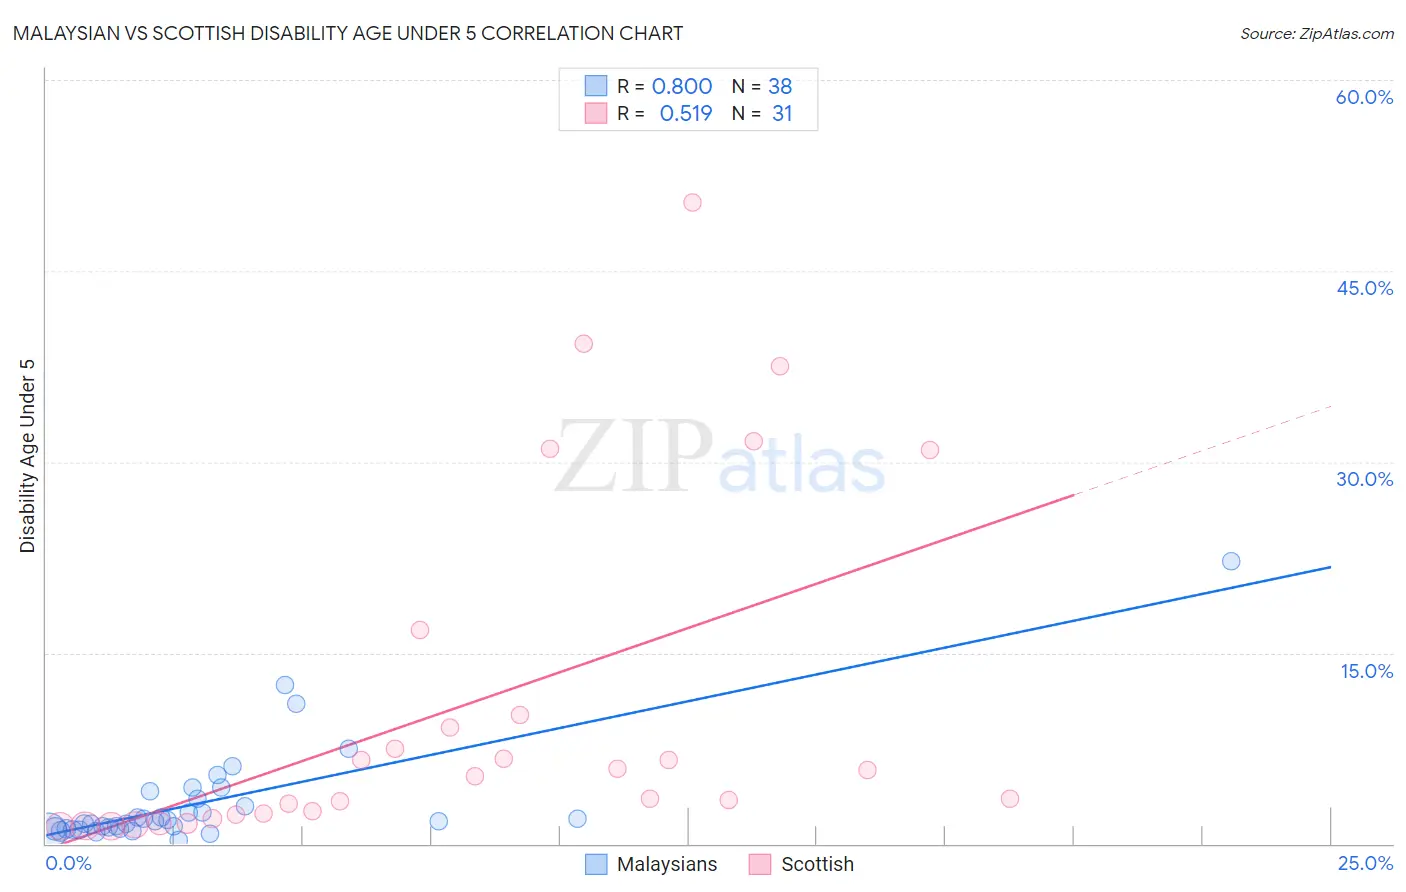
Malaysian vs Scottish Disability Age Under 5 Correlation Chart
The statistical analysis conducted on geographies consisting of 149,792,432 people shows a strong positive correlation between the proportion of Malaysians and percentage of population with a disability under the age of 5 in the United States with a correlation coefficient (R) of 0.800 and weighted average of 1.3%. Similarly, the statistical analysis conducted on geographies consisting of 258,599,259 people shows a substantial positive correlation between the proportion of Scottish and percentage of population with a disability under the age of 5 in the United States with a correlation coefficient (R) of 0.519 and weighted average of 1.6%, a difference of 27.4%.
Disability Age Under 5 Correlation Summary
| Measurement | Malaysian | Scottish |
| Minimum | 0.28% | 1.4% |
| Maximum | 22.2% | 50.4% |
| Range | 21.9% | 49.0% |
| Mean | 3.2% | 10.8% |
| Median | 1.8% | 5.3% |
| Interquartile 25% (IQ1) | 1.2% | 2.3% |
| Interquartile 75% (IQ3) | 3.5% | 10.1% |
| Interquartile Range (IQR) | 2.3% | 7.8% |
| Standard Deviation (Sample) | 4.1% | 13.7% |
| Standard Deviation (Population) | 4.1% | 13.4% |
Similar Demographics by Disability Age Under 5
Demographics Similar to Malaysians by Disability Age Under 5
In terms of disability age under 5, the demographic groups most similar to Malaysians are Cypriot (1.3%, a difference of 0.31%), Immigrants from Croatia (1.3%, a difference of 0.40%), Bangladeshi (1.3%, a difference of 0.41%), Syrian (1.3%, a difference of 0.51%), and Immigrants from Chile (1.3%, a difference of 0.68%).
| Demographics | Rating | Rank | Disability Age Under 5 |
| Immigrants | Greece | 19.1 /100 | #211 | Poor 1.3% |
| Chileans | 18.8 /100 | #212 | Poor 1.3% |
| Immigrants | Sudan | 18.7 /100 | #213 | Poor 1.3% |
| Immigrants | Chile | 17.2 /100 | #214 | Poor 1.3% |
| Syrians | 16.1 /100 | #215 | Poor 1.3% |
| Bangladeshis | 15.5 /100 | #216 | Poor 1.3% |
| Cypriots | 14.9 /100 | #217 | Poor 1.3% |
| Malaysians | 13.2 /100 | #218 | Poor 1.3% |
| Immigrants | Croatia | 11.2 /100 | #219 | Poor 1.3% |
| Serbians | 9.6 /100 | #220 | Tragic 1.3% |
| Sub-Saharan Africans | 8.3 /100 | #221 | Tragic 1.3% |
| Ukrainians | 8.3 /100 | #222 | Tragic 1.3% |
| Hispanics or Latinos | 7.7 /100 | #223 | Tragic 1.3% |
| Latvians | 7.1 /100 | #224 | Tragic 1.3% |
| Panamanians | 7.1 /100 | #225 | Tragic 1.3% |
Demographics Similar to Scottish by Disability Age Under 5
In terms of disability age under 5, the demographic groups most similar to Scottish are Creek (1.6%, a difference of 0.070%), Blackfeet (1.6%, a difference of 0.10%), Navajo (1.6%, a difference of 0.14%), Seminole (1.6%, a difference of 0.26%), and Cape Verdean (1.7%, a difference of 0.77%).
| Demographics | Rating | Rank | Disability Age Under 5 |
| Shoshone | 0.0 /100 | #300 | Tragic 1.6% |
| German Russians | 0.0 /100 | #301 | Tragic 1.6% |
| Welsh | 0.0 /100 | #302 | Tragic 1.6% |
| Swiss | 0.0 /100 | #303 | Tragic 1.6% |
| Seminole | 0.0 /100 | #304 | Tragic 1.6% |
| Blackfeet | 0.0 /100 | #305 | Tragic 1.6% |
| Creek | 0.0 /100 | #306 | Tragic 1.6% |
| Scottish | 0.0 /100 | #307 | Tragic 1.6% |
| Navajo | 0.0 /100 | #308 | Tragic 1.6% |
| Cape Verdeans | 0.0 /100 | #309 | Tragic 1.7% |
| Whites/Caucasians | 0.0 /100 | #310 | Tragic 1.7% |
| English | 0.0 /100 | #311 | Tragic 1.7% |
| Puerto Ricans | 0.0 /100 | #312 | Tragic 1.7% |
| Celtics | 0.0 /100 | #313 | Tragic 1.7% |
| Norwegians | 0.0 /100 | #314 | Tragic 1.7% |