Immigrants from Korea vs Scottish Disability Age Under 5
COMPARE
Immigrants from Korea
Scottish
Disability Age Under 5
Disability Age Under 5 Comparison
Immigrants from Korea
Scottish
1.1%
DISABILITY AGE UNDER 5
98.8/ 100
METRIC RATING
65th/ 347
METRIC RANK
1.6%
DISABILITY AGE UNDER 5
0.0/ 100
METRIC RATING
307th/ 347
METRIC RANK
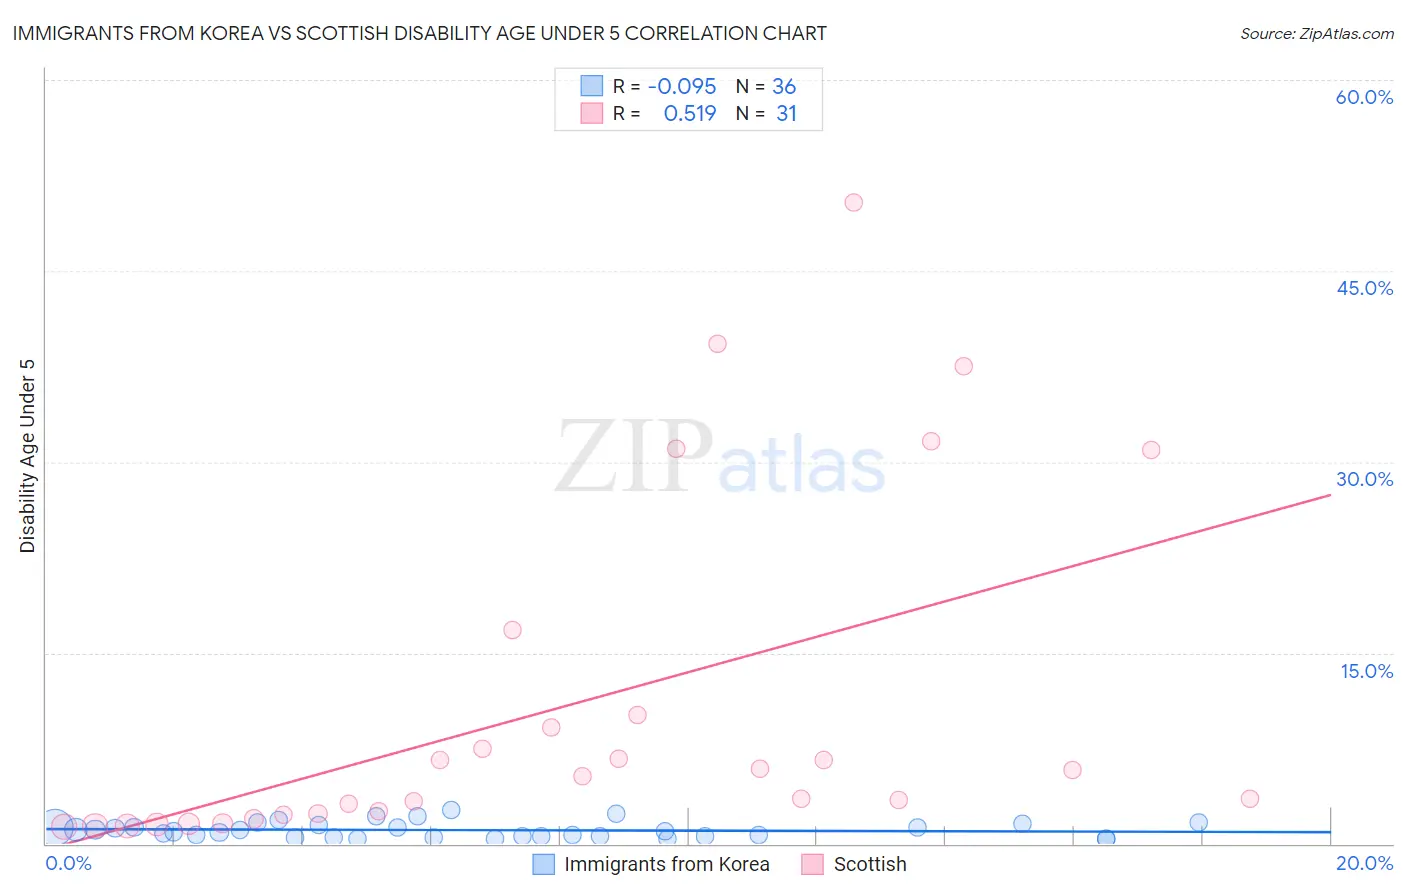
Immigrants from Korea vs Scottish Disability Age Under 5 Correlation Chart
The statistical analysis conducted on geographies consisting of 221,993,484 people shows a slight negative correlation between the proportion of Immigrants from Korea and percentage of population with a disability under the age of 5 in the United States with a correlation coefficient (R) of -0.095 and weighted average of 1.1%. Similarly, the statistical analysis conducted on geographies consisting of 258,599,259 people shows a substantial positive correlation between the proportion of Scottish and percentage of population with a disability under the age of 5 in the United States with a correlation coefficient (R) of 0.519 and weighted average of 1.6%, a difference of 47.5%.
Disability Age Under 5 Correlation Summary
| Measurement | Immigrants from Korea | Scottish |
| Minimum | 0.35% | 1.4% |
| Maximum | 2.6% | 50.4% |
| Range | 2.3% | 49.0% |
| Mean | 1.1% | 10.8% |
| Median | 0.95% | 5.3% |
| Interquartile 25% (IQ1) | 0.59% | 2.3% |
| Interquartile 75% (IQ3) | 1.4% | 10.1% |
| Interquartile Range (IQR) | 0.82% | 7.8% |
| Standard Deviation (Sample) | 0.61% | 13.7% |
| Standard Deviation (Population) | 0.60% | 13.4% |
Similar Demographics by Disability Age Under 5
Demographics Similar to Immigrants from Korea by Disability Age Under 5
In terms of disability age under 5, the demographic groups most similar to Immigrants from Korea are Immigrants from Indonesia (1.1%, a difference of 0.13%), Immigrants from Belize (1.1%, a difference of 0.19%), South African (1.1%, a difference of 0.23%), Israeli (1.1%, a difference of 0.26%), and Egyptian (1.1%, a difference of 0.34%).
| Demographics | Rating | Rank | Disability Age Under 5 |
| Immigrants | Egypt | 99.4 /100 | #58 | Exceptional 1.1% |
| Immigrants | Malaysia | 99.4 /100 | #59 | Exceptional 1.1% |
| Immigrants | Western Asia | 99.2 /100 | #60 | Exceptional 1.1% |
| Immigrants | Ethiopia | 99.2 /100 | #61 | Exceptional 1.1% |
| Immigrants | Switzerland | 99.2 /100 | #62 | Exceptional 1.1% |
| Immigrants | Vietnam | 99.1 /100 | #63 | Exceptional 1.1% |
| Egyptians | 98.9 /100 | #64 | Exceptional 1.1% |
| Immigrants | Korea | 98.8 /100 | #65 | Exceptional 1.1% |
| Immigrants | Indonesia | 98.7 /100 | #66 | Exceptional 1.1% |
| Immigrants | Belize | 98.7 /100 | #67 | Exceptional 1.1% |
| South Africans | 98.7 /100 | #68 | Exceptional 1.1% |
| Israelis | 98.7 /100 | #69 | Exceptional 1.1% |
| Immigrants | Ecuador | 98.6 /100 | #70 | Exceptional 1.1% |
| Trinidadians and Tobagonians | 98.6 /100 | #71 | Exceptional 1.1% |
| Burmese | 98.5 /100 | #72 | Exceptional 1.1% |
Demographics Similar to Scottish by Disability Age Under 5
In terms of disability age under 5, the demographic groups most similar to Scottish are Creek (1.6%, a difference of 0.070%), Blackfeet (1.6%, a difference of 0.10%), Navajo (1.6%, a difference of 0.14%), Seminole (1.6%, a difference of 0.26%), and Cape Verdean (1.7%, a difference of 0.77%).
| Demographics | Rating | Rank | Disability Age Under 5 |
| Shoshone | 0.0 /100 | #300 | Tragic 1.6% |
| German Russians | 0.0 /100 | #301 | Tragic 1.6% |
| Welsh | 0.0 /100 | #302 | Tragic 1.6% |
| Swiss | 0.0 /100 | #303 | Tragic 1.6% |
| Seminole | 0.0 /100 | #304 | Tragic 1.6% |
| Blackfeet | 0.0 /100 | #305 | Tragic 1.6% |
| Creek | 0.0 /100 | #306 | Tragic 1.6% |
| Scottish | 0.0 /100 | #307 | Tragic 1.6% |
| Navajo | 0.0 /100 | #308 | Tragic 1.6% |
| Cape Verdeans | 0.0 /100 | #309 | Tragic 1.7% |
| Whites/Caucasians | 0.0 /100 | #310 | Tragic 1.7% |
| English | 0.0 /100 | #311 | Tragic 1.7% |
| Puerto Ricans | 0.0 /100 | #312 | Tragic 1.7% |
| Celtics | 0.0 /100 | #313 | Tragic 1.7% |
| Norwegians | 0.0 /100 | #314 | Tragic 1.7% |