Immigrants from Haiti vs Scottish Disability Age Under 5
COMPARE
Immigrants from Haiti
Scottish
Disability Age Under 5
Disability Age Under 5 Comparison
Immigrants from Haiti
Scottish
1.3%
DISABILITY AGE UNDER 5
40.2/ 100
METRIC RATING
187th/ 347
METRIC RANK
1.6%
DISABILITY AGE UNDER 5
0.0/ 100
METRIC RATING
307th/ 347
METRIC RANK
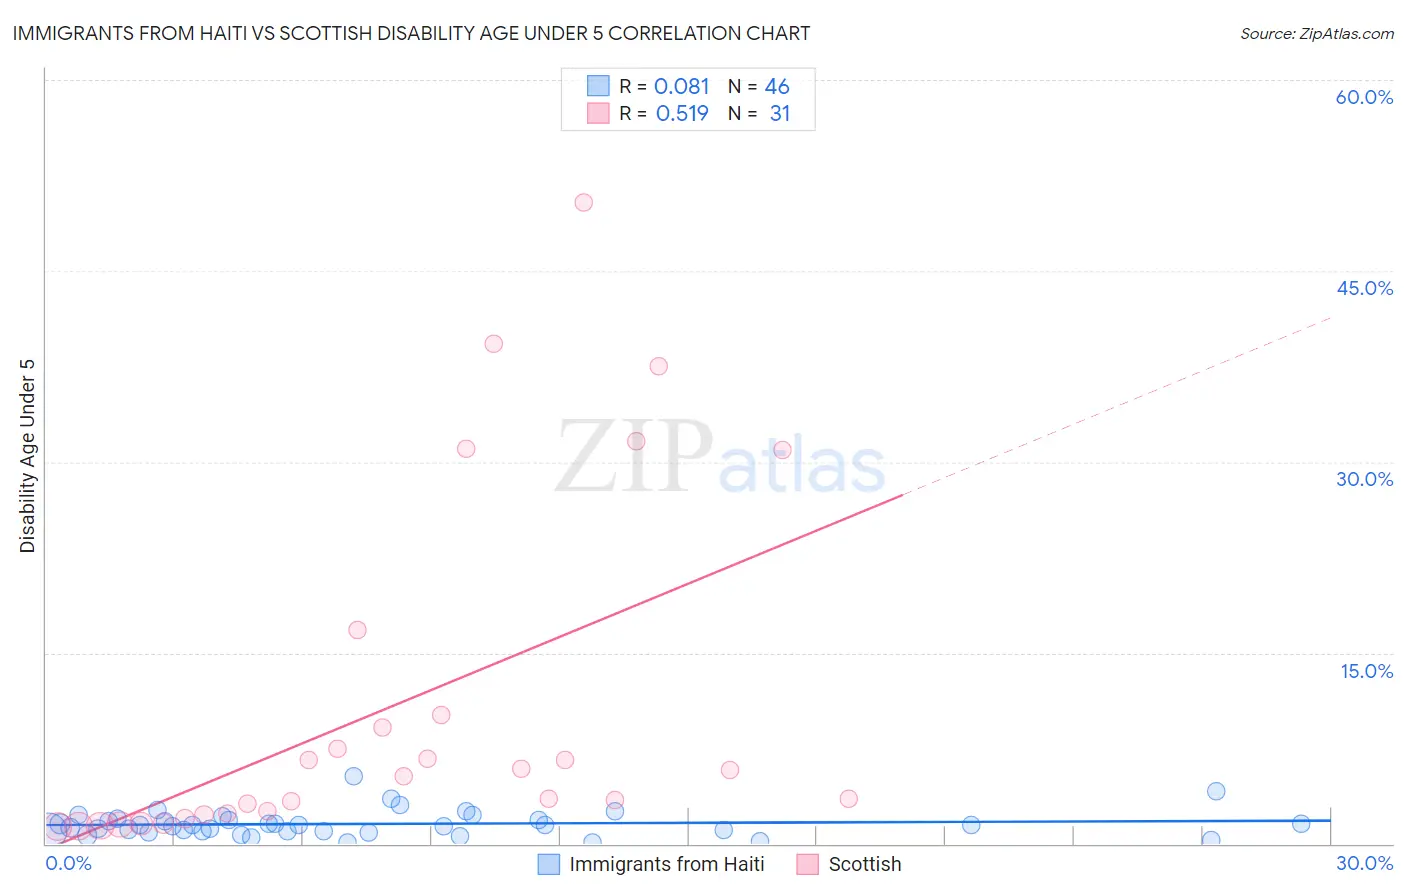
Immigrants from Haiti vs Scottish Disability Age Under 5 Correlation Chart
The statistical analysis conducted on geographies consisting of 137,993,145 people shows a slight positive correlation between the proportion of Immigrants from Haiti and percentage of population with a disability under the age of 5 in the United States with a correlation coefficient (R) of 0.081 and weighted average of 1.3%. Similarly, the statistical analysis conducted on geographies consisting of 258,599,259 people shows a substantial positive correlation between the proportion of Scottish and percentage of population with a disability under the age of 5 in the United States with a correlation coefficient (R) of 0.519 and weighted average of 1.6%, a difference of 31.6%.
Disability Age Under 5 Correlation Summary
| Measurement | Immigrants from Haiti | Scottish |
| Minimum | 0.082% | 1.4% |
| Maximum | 5.3% | 50.4% |
| Range | 5.2% | 49.0% |
| Mean | 1.6% | 10.8% |
| Median | 1.5% | 5.3% |
| Interquartile 25% (IQ1) | 1.0% | 2.3% |
| Interquartile 75% (IQ3) | 1.9% | 10.1% |
| Interquartile Range (IQR) | 0.90% | 7.8% |
| Standard Deviation (Sample) | 1.0% | 13.7% |
| Standard Deviation (Population) | 1.0% | 13.4% |
Similar Demographics by Disability Age Under 5
Demographics Similar to Immigrants from Haiti by Disability Age Under 5
In terms of disability age under 5, the demographic groups most similar to Immigrants from Haiti are Haitian (1.3%, a difference of 0.020%), Immigrants from Western Africa (1.2%, a difference of 0.21%), Cuban (1.2%, a difference of 0.21%), Peruvian (1.3%, a difference of 0.24%), and Palestinian (1.2%, a difference of 0.26%).
| Demographics | Rating | Rank | Disability Age Under 5 |
| Immigrants | Mexico | 44.4 /100 | #180 | Average 1.2% |
| Macedonians | 43.7 /100 | #181 | Average 1.2% |
| Immigrants | Peru | 43.7 /100 | #181 | Average 1.2% |
| Immigrants | Saudi Arabia | 43.3 /100 | #183 | Average 1.2% |
| Palestinians | 43.0 /100 | #184 | Average 1.2% |
| Immigrants | Western Africa | 42.5 /100 | #185 | Average 1.2% |
| Cubans | 42.5 /100 | #186 | Average 1.2% |
| Immigrants | Haiti | 40.2 /100 | #187 | Average 1.3% |
| Haitians | 39.9 /100 | #188 | Fair 1.3% |
| Peruvians | 37.6 /100 | #189 | Fair 1.3% |
| Immigrants | Laos | 36.6 /100 | #190 | Fair 1.3% |
| Mexican American Indians | 36.6 /100 | #191 | Fair 1.3% |
| Immigrants | Bosnia and Herzegovina | 36.5 /100 | #192 | Fair 1.3% |
| Immigrants | Sierra Leone | 36.5 /100 | #193 | Fair 1.3% |
| Immigrants | North Macedonia | 34.7 /100 | #194 | Fair 1.3% |
Demographics Similar to Scottish by Disability Age Under 5
In terms of disability age under 5, the demographic groups most similar to Scottish are Creek (1.6%, a difference of 0.070%), Blackfeet (1.6%, a difference of 0.10%), Navajo (1.6%, a difference of 0.14%), Seminole (1.6%, a difference of 0.26%), and Cape Verdean (1.7%, a difference of 0.77%).
| Demographics | Rating | Rank | Disability Age Under 5 |
| Shoshone | 0.0 /100 | #300 | Tragic 1.6% |
| German Russians | 0.0 /100 | #301 | Tragic 1.6% |
| Welsh | 0.0 /100 | #302 | Tragic 1.6% |
| Swiss | 0.0 /100 | #303 | Tragic 1.6% |
| Seminole | 0.0 /100 | #304 | Tragic 1.6% |
| Blackfeet | 0.0 /100 | #305 | Tragic 1.6% |
| Creek | 0.0 /100 | #306 | Tragic 1.6% |
| Scottish | 0.0 /100 | #307 | Tragic 1.6% |
| Navajo | 0.0 /100 | #308 | Tragic 1.6% |
| Cape Verdeans | 0.0 /100 | #309 | Tragic 1.7% |
| Whites/Caucasians | 0.0 /100 | #310 | Tragic 1.7% |
| English | 0.0 /100 | #311 | Tragic 1.7% |
| Puerto Ricans | 0.0 /100 | #312 | Tragic 1.7% |
| Celtics | 0.0 /100 | #313 | Tragic 1.7% |
| Norwegians | 0.0 /100 | #314 | Tragic 1.7% |